Variance is a measurement value used to find how the data is spread with respect to the mean or the average value of the data set. It is used to find how the distribution data is spread out with respect to the mean or the average value. The symbol used to define the variance is σ2. It is the square of the Standard Deviation.
The are two types of variance used in statistics,
- Sample Variance
- Population Variance
The population variance is used to determine how each data point in a particular population fluctuates or is spread out, while the sample variance is used to find the average of the squared deviations from the mean.
In this article, we will learn about Variance (Sample, Population), their formulas, properties, and others in detail.
Variance Definition
We measure the various values of the data and these values are used for a variety of purposes. The data can be given in two types grouped data, or ungrouped (discrete) data. If the data is given in the form of class intervals it is called grouped data whereas if the data is given in the form of a single data point it is referred to as a discrete or ungrouped data point. Variance is the measure of the dispersion of the data with respect to the mean value of the data. It tells us how the data is dispersed in the given data value. We can easily calculate the sample variance and population variance for both grouped and ungrouped data.
Types of Variance
We can define the variance of the given data in two types,
- Population Variance
- Sample Variance
Now let’s learn about them in detail.
Population Variance
Population variance is used to find the spread of the given population. The population is defined as a group of people and all the people in that group are part of the population. It tells us about how the population of a group varies with respect to the mean population.
All the members of a group are known as the population. When we want to find how each data point in a given population varies or is spread out then we use the population variance. It is used to give the squared distance of each data point from the population mean.
Sample Variance
If the population data is very large it becomes difficult to calculate the population variance of the data set. In that case, we take a sample of data from the given data set and find the variance of that data set which is called sample variance. While calculating the sample mean we make sure to calculate the sample mean, i.e. the mean of the sample data set not the population mean. We can define the sample variance as the mean of the square of the difference between the sample data point and the sample mean.
Variance Symbol
The symbol for variance is typically represented by the Greek letter sigma squared (σ²) when referring to the population variance. For sample variance, it’s often denoted by s².
Variance Example
We can understand the concept of variance with the help of the example discussed below.
Find the population variance of the data {4,6,8,10}
Solution:
Mean = (4+6+8+10)/4 = 7
| 4 |
(4-7)2 |
9 |
| 6 |
(6-7)2 |
1 |
| 8 |
(8-7)2 |
1 |
| 10 |
(10-7)2 |
9 |
Variance = (9+1+1+9)/4 = 20/5 =4
Thus, the variance of the data is 7
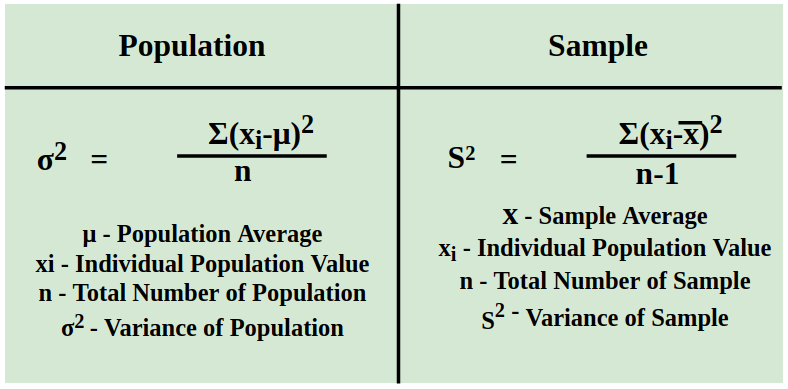
The variance for a data set is denoted by the symbol σ2. For population data, its formula is equal to the sum of squared differences of data entries from the mean divided by the number of entries. While for sample data, we divide the numerator value by the difference between the number of entries and unity.
Sample Variance Formula
If the data set is a sample the formula of variance is given by,
σ2 = ∑ (xi – x̄)2/(n – 1)
where,
- x̄ is the mean of sample data set
- n is the total number of observations
Population Variance Formula
If we have a population data set, the formula is written as,
σ2 = ∑ (xi – x̄)2/n
where,
- x̄ is the mean of population data set
- n is the total number of observations
We can also calculate the variance for grouped and ungrouped data sets. Various formulas for the variance are,
Variance Formula for Grouped Data
For grouped data, the variance formula is discussed below,
Sample Variance Formula for Grouped Data (σ2) = ∑ f(mi – x̄)2/(n-1)
Population Variance Formula for Grouped Data (σ2) = ∑ f(mi – x̄)2/n
where,
- f is the frequency of each interval
- mi is the midpoint of the ith interval
- x̄ is the mean of the grouped data
For grouped data mean is calculated as,
Mean = ∑ (fixi) / ∑ fi
Variance Formula for Ungrouped Data
For ungrouped data, the variance formula is discussed below,
- Sample Variance Formula for Ungrouped Data (σ2) = ∑ (xi – x̄)2/(n-1)
- Population Variance Formula for Ungrouped Data (σ2) = ∑ (xi – x̄)2/n
where x̄ is the mean of the grouped data
Formula for Calculating Variance
The formula used for calculating the Variance is discussed in the image below,
How to Calculate Variance?
In general, variance means population standard variance. The steps to calculate the variance of a given set of values is,
Step 1: Calculate the mean of the observation using the formula (Mean = Sum of Observations/Number of Observations)
Step 2: Calculate the squared differences of the data values from the mean. (Data Value – Mean)2
Step 3: Calculate the average of the squared differences of the given values which are called the variance of the data set.
(Variance = Sum of Squared Differences / Number of Observations)
Variance and Standard Deviation
Variance and Standard Deviation both are measures of the central tendency that is used to tell us about the extent to which the values of the data set deviate with respect to the central or the mean value of the data set.
There is a definite relationship between Variance and Standard Deviation for any given data set.
Variance = (Standard Deviation)2
Variance is defined as the square of the standard deviation, i.e. taking the square of the standard deviation for any group of data gives us the variance of that data set. variance is defined using the symbol σ2 whereas σ is used to define the Standard Deviation of the data set. Variance of the data set is expressed in squared units while the standard deviation of the data set is expressed in a unit similar to the mean of the data set.
Learn more about, Variance and Standard Deviation
Variance of Binomial Distribution
Binomial Distribution is the discrete probability distribution that tells us the number of positive outcomes in a binomial experiment performed n number of times. The outcome of the binomial experiment is 0 or 1, i.e. either positive or negative.
In the binomial experiment of n trials and where the probability of each trial is given p, then the variance of the binomial distribution is given using,
σ2 = np (1 – p)
where ‘np’ is defined as the mean of the values of the binomial distribution.
Variance of Poisson Distribution
Poison Distribution is defined as a discrete probability distribution that is used to define the probability of the ‘n’ number of events occurring within the ‘x’ time period. The mean in the Poisson distribution is defined by the symbol λ.
In the Poisson Distribution, the mean and the variance of the given data set are equal. The variance of the Poisson distribution is given using the formula,
σ2 = λ
Variance of Uniform Distribution
In a uniform distribution, the probability distribution data is continuous. The outcome in these experiments lies in the range between a specific upper bound and a specific lower bound and thus these distributions are also called Rectangular Distributions. If the upper bound or the maximum bound is “b” and the lower bound or the minimum bound is “a” then the variance of the uniform distribution is calculated using the formula,
σ2 = (1/12)(b – a)2
The mean of the uniform distribution is given using the formula,
Mean = (b + a) / 2
where,
- b is the upper bound of the uniform distribution
- a is the lower bound of the uniform distribution
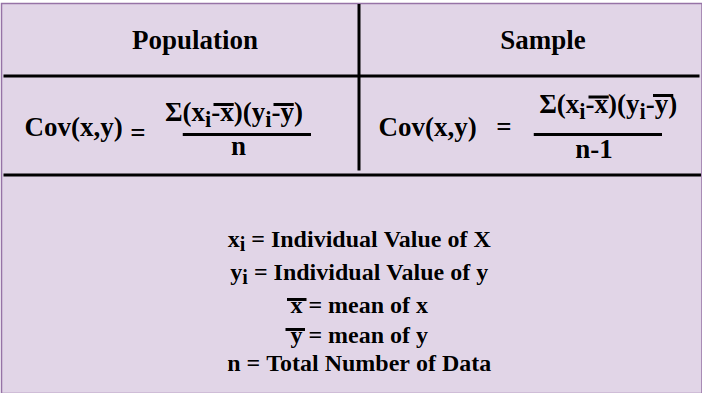
Variance and Covariance
Variance of the data set defines the volatility of all the values of the data set with respect to the mean value of the data set. Covariance tells us how the random variables are related to each other and it tells us how the change in one variable affects the change in other variables.
Covariance can be positive or negative, the positive covariance signifies that both variables are moving in the same direction with respect to the mean value whereas, negative covariance signifies that both variables are moving in opposite directions with respect to the mean value.
For two random variables x and y where x is the dependent variable and y is the independent variable the covariance is calculated using the formula mentioned in the below attached image.
Variance Properties
Variance is widely used in Mathematics, Statistics, and other branches of science for a variety of purposes. Variance has various properties which are widely used for solving various problems. Some of the basic properties of the variance are,
- Variance of the data set is the non-negative quantity and the zero value of variance signifies that all the values of the data set are equal.
- A higher value of the variance tells us that all the data values of the data set are widely dispersed, i.e. they are far away form the mean value of the data set.
- A lower value of the variance tells us that all the data values of the data set are close to each other, i.e. they are very close form the mean value of the data set.
For any constant ‘c’
where x is a random variable
where x is a random variable
Also, if a and b are the constant value and x is a random variable then,
For independent variables x1, x2, x3…,xn we know that,
- Var(x1 + x2 +……+ xn) = Var(x1) + Var(x2) +……..+Var(xn)
Read More,
Example 1: Calculate the variance of the sample data: 7, 11, 15, 19, 24.
Solution:
We have the data, 7, 11, 15, 19, 24
Find mean of the data.
x̄ = (7 + 11 + 15 + 19 + 24)/5
= 76/5
= 15.2
Using the formula for variance we get,
σ2 = ∑ (xi – x̄)2/(n – 1)
= (67.24 + 17.64 + 0.04 + 14.44 + 77.44)/(5 – 1)
= 176.8/4
= 44.2
Example 2: Calculate the number of observations if the variance of data is 12 and the sum of squared differences of data from the mean is 156.
Solution:
We have,
(xi – x̄)2 = 156
σ2 = 12
Using the formula for variance we get,
σ2 = ∑ (xi – x̄)2/n
12 = 156/n
n = 156/12
n = 13
Example 3: Calculate the variance for the given data
Solution:
Mean (x̄) = ∑(fi xi)/∑(fi)
= (10×1 + 4×3 + 6×5 + 8×1)/(1+3+5+1)
= 60/10 = 6
n = ∑(fi) = 1+3+5+1 = 10
|
xi
|
fi
|
fixi
|
(xi – x̄)
|
(xi – x̄)2
|
fi(xi – x̄)2
|
| 10 |
1 |
10 |
4 |
16 |
16 |
| 4 |
3 |
12 |
-2 |
4 |
12 |
| 6 |
5 |
30 |
0 |
0 |
0 |
| 8 |
1 |
8 |
2 |
4 |
8 |
Now,
σ2 = (∑in fi(xi – x̄)2/n)
= [(16 + 12 + 0 +8)/10]
= 3.6
Variance(σ2) = 3.6
Example 4: Find the variance of the following data table
|
Class
|
Frequency
|
| 0-10 |
3 |
| 10-20 |
6 |
| 20-30 |
4 |
| 30-40 |
2 |
| 40-50 |
1 |
Solution:
|
Class
|
Xi
|
fi
|
f×Xi
|
Xi – μ
|
(Xi – μ)2
|
f×(Xi – μ)2
|
|
0-10
|
5
|
3
|
15
|
-15
|
225
|
675
|
|
10-20
|
15
|
6
|
90
|
-5
|
25
|
150
|
|
20-30
|
25
|
4
|
100
|
5
|
25
|
100
|
|
30-40
|
35
|
2
|
70
|
15
|
225
|
450
|
|
40-50
|
45
|
1
|
45
|
25
|
625
|
625
|
|
Total
|
|
16
|
320
|
|
|
2000
|
Mean (μ) = ∑(fi xi)/∑(fi)
= 320/16 = 20
σ2 = (∑in fi(xi – μ)2/n)
= [(2000)/(16)]
= (125)
The variance of given data set is 125.
Variance – FAQs
What is Variance in Statistics?
Variance is defined as the spread of the values of the data set with respect to the mean value of the data set. The variance of the data set tells the extent to which the values in a particular data set spread from the mean value.
What is the Symbol of Variance?
We use the symbols σ2, s2, and Var(x) to denote the Variance of the data set.
What is the Formula of Variance?
Variance of the data set is calculated using the formula,
σ2 = E[( X – μ)2]
What does Variance tell?
Variance is used to find the extent of the spread of the data i.e. it tells us how the values in a data set are spread out with respect to the mean value. For the larger value of variance, the values are widely spread with respect to the mean value whereas with respect to the smaller value of variance, the values are closely spread with respect to the mean value
What is the Relation between Variance and Standard Deviation?
For the given data set variance of the data set is the square of the standard deviation of that data set. This relation is expressed as,
Variance = (Standard Deviation)2
How Do You Calculate Variance?
To calculate variance, you first find the mean (average) of the data set. Then, subtract the mean from each data point and square the result. Finally, average these squared differences.
Why is Variance Important?
Variance is crucial for understanding the distribution of data within a dataset. It helps in determining how spread out the data points are from the average value, indicating the variability or consistency within the data.
What is the Difference Between Variance and Standard Deviation?
While both variance and standard deviation measure data dispersion, the standard deviation is the square root of the variance. Standard deviation is expressed in the same units as the data, making it more interpretable for indicating the spread.
Can Variance be Negative?
No, variance cannot be negative. Since it is calculated as the average of the squared differences from the mean, the resulting value is always non-negative.
Share your thoughts in the comments
Please Login to comment...