Cause Effect Graphing in Software Engineering
Last Updated :
28 Mar, 2020
Prerequisite – Black Box Testing
Cause Effect Graphing based technique is a technique in which a graph is used to represent the situations of combinations of input conditions. The graph is then converted to a decision table to obtain the test cases. Cause-effect graphing technique is used because boundary value analysis and equivalence class partitioning methods do not consider the combinations of input conditions. But since there may be some critical behaviour to be tested when some combinations of input conditions are considered, that is why cause-effect graphing technique is used.
Steps used in deriving test cases using this technique are:
- Division of specification:
Since it is difficult to work with cause-effect graphs of large specifications as they are complex, the specifications are divided into small workable pieces and then converted into cause-effect graphs separately.
- Identification of cause and effects:
This involves identifying the causes(distinct input conditions) and effects(output conditions) in the specification.
- Transforming the specifications into a cause-effect graph:
The causes and effects are linked together using Boolean expressions to obtain a cause-effect graph. Constraints are also added between causes and effects if possible.
- Conversion into decision table:
The cause-effect graph is then converted into a limited entry decision table. If you’re not aware of the concept of decision tables, check out this link.
- Deriving test cases:
Each column of the decision-table is converted into a test case.
Basic Notations used in Cause-effect graph:
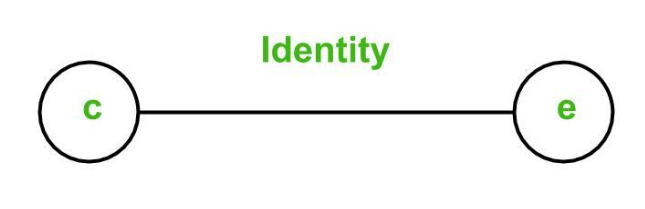
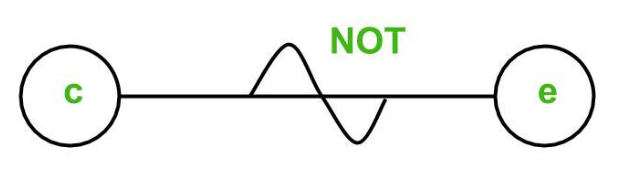
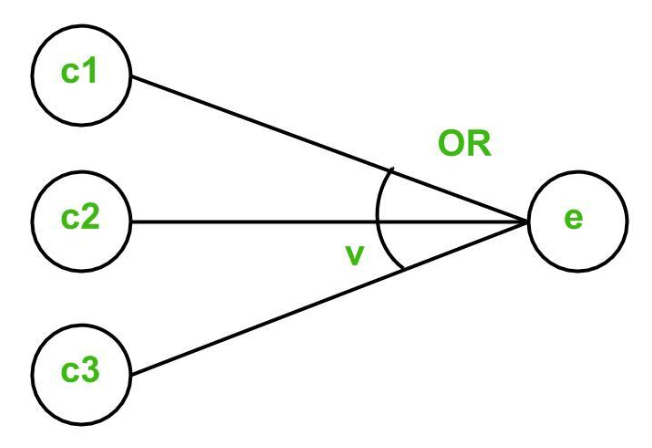
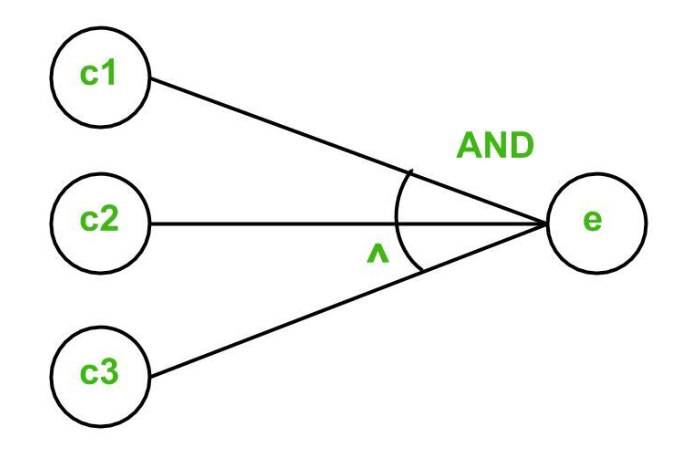
Here c represents cause and e represents effect.
The following notations are always used between a cause and an effect:
- Identity Function: if c is 1, then e is 1. Else e is 0.
- NOT Function: if c is 1, then e is 0. Else e is 1.
- OR Function: if c1 or c2 or c3 is 1, then e is 1. Else e is 0.
- AND Function: if both c1 and c2 and c3 is 1, then e is 1. Else e is 0.
To represent some impossible combinations of causes or impossible combinations of effects, constraints are used. The following constraints are used in cause-effect graphs:
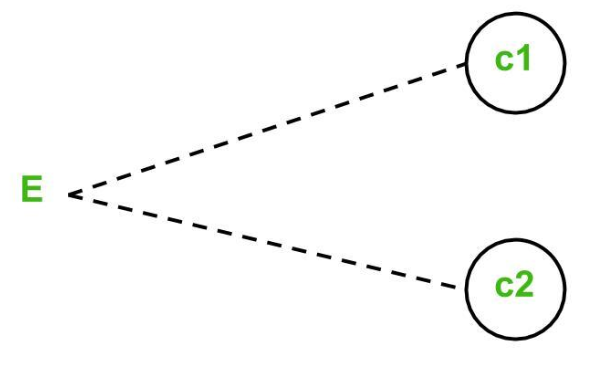
- Exclusive constraint or E-constraint: This constraint exists between causes. It states that either c1 or c2 can be 1, i.e., c1 and c2 cannot be 1 simultaneously.
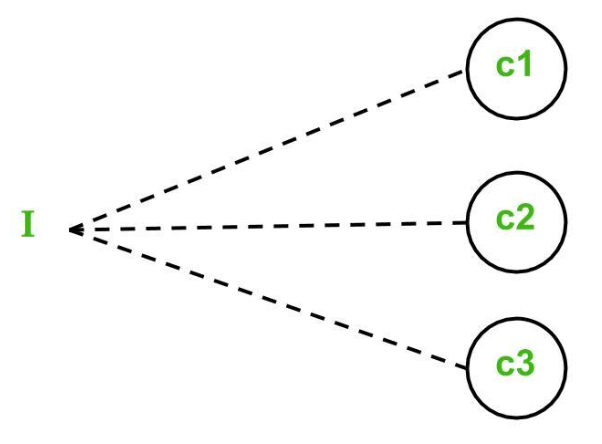
- Inclusive constraint or I-constraint: This constraint exists between causes. It states that atleast one of c1, c2 and c3 must always be 1, i.e., c1, c2 and c3 cannot be 0 simultaneously.
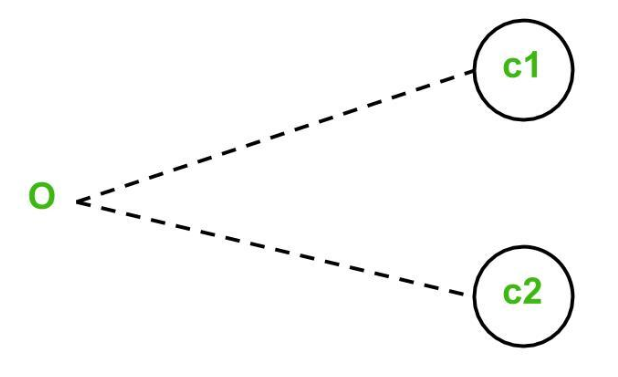
- One and Only One constraint or O-constraint: This constraint exists between causes. It states that one and only one of c1 and c2 must be 1.
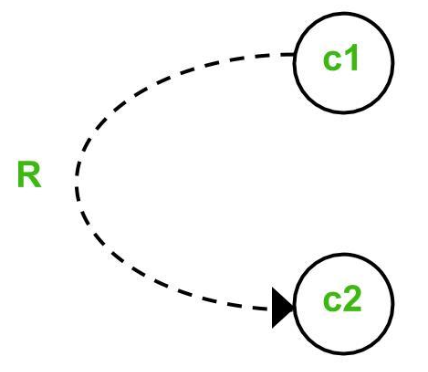
- Requires constraint or R-constraint: This constraint exists between causes. It states that for c1 to be 1, c2 must be 1. It is impossible for c1 to be 1 and c2 to be 0.
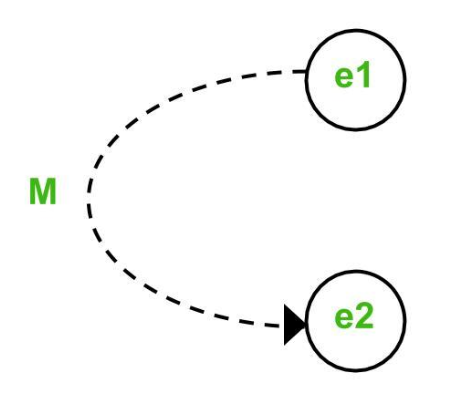
- Mask constraint or M-constraint: This constraint exists between effects. It states that if effect e1 is 1, the effect e2 is forced to be 0.
Share your thoughts in the comments
Please Login to comment...