ML | K-means++ Algorithm
Last Updated :
21 Mar, 2024
Prerequisite: K-means Clustering – Introduction
Drawback of standard K-means algorithm:
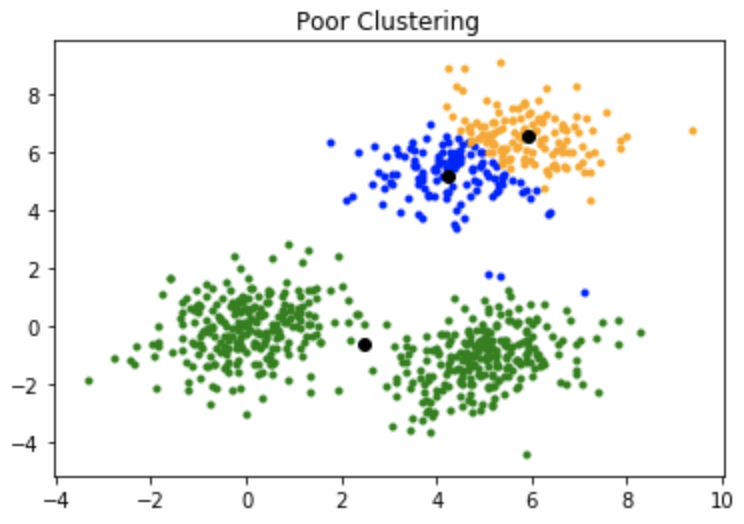
One disadvantage of the K-means algorithm is that it is sensitive to the initialization of the centroids or the mean points. So, if a centroid is initialized to be a “far-off” point, it might just end up with no points associated with it, and at the same time, more than one cluster might end up linked with a single centroid. Similarly, more than one centroid might be initialized into the same cluster resulting in poor clustering. For example, consider the images shown below.
A poor initialization of centroids resulted in poor clustering.
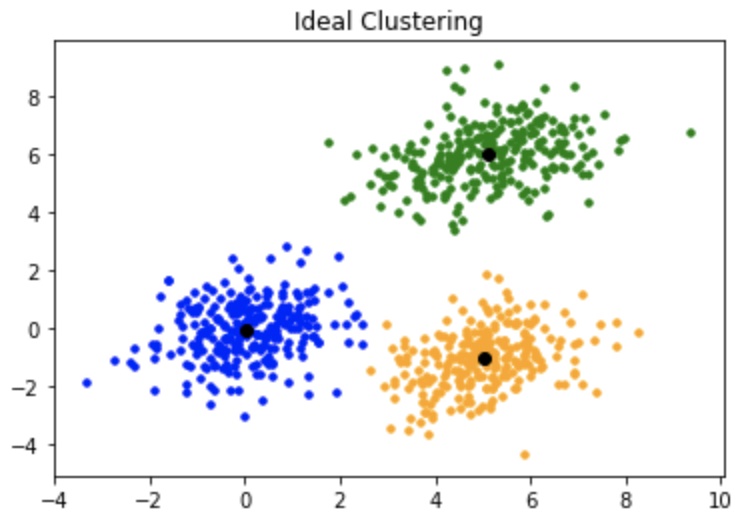
This is how the clustering should have been:
K-mean++:
To overcome the above-mentioned drawback we use K-means++. This algorithm ensures a smarter initialization of the centroids and improves the quality of the clustering. Apart from initialization, the rest of the algorithm is the same as the standard K-means algorithm. That is K-means++ is the standard K-means algorithm coupled with a smarter initialization of the centroids.
Initialization algorithm:
The steps involved are:
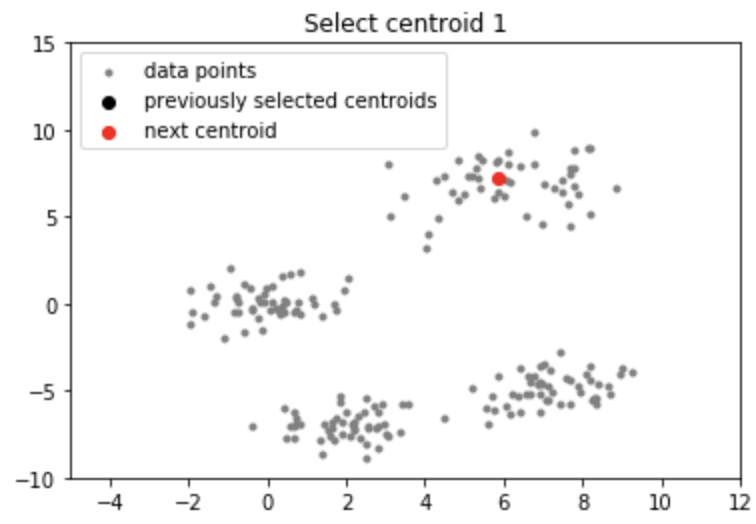
- Randomly select the first centroid from the data points.
- For each data point compute its distance from the nearest, previously chosen centroid.
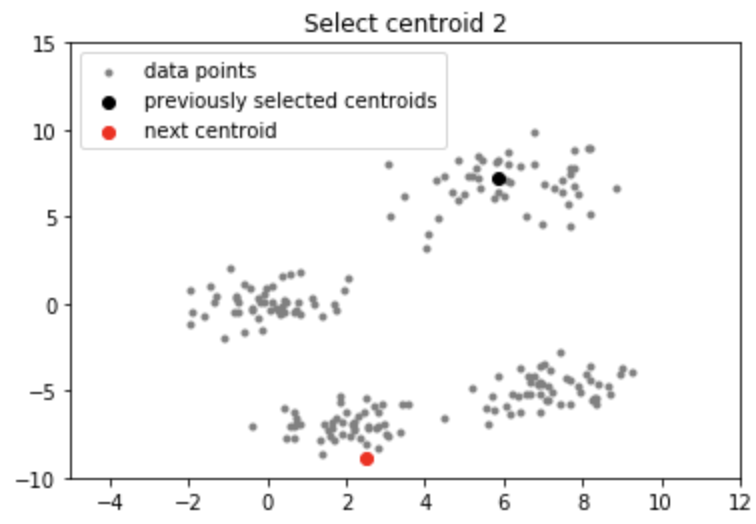
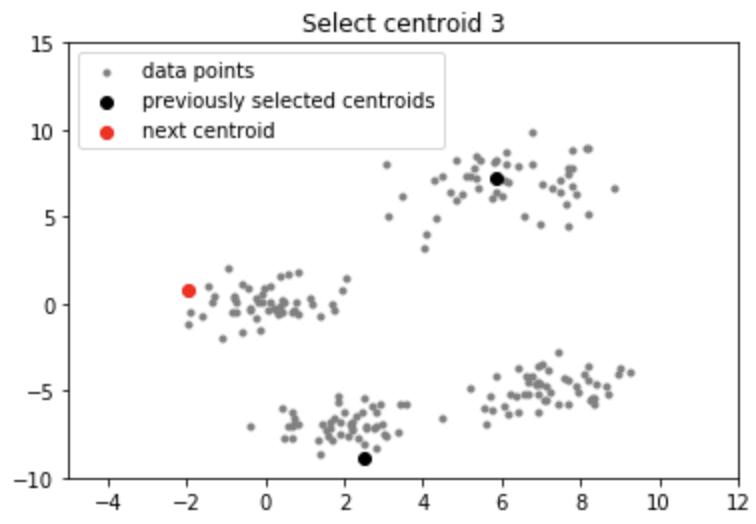
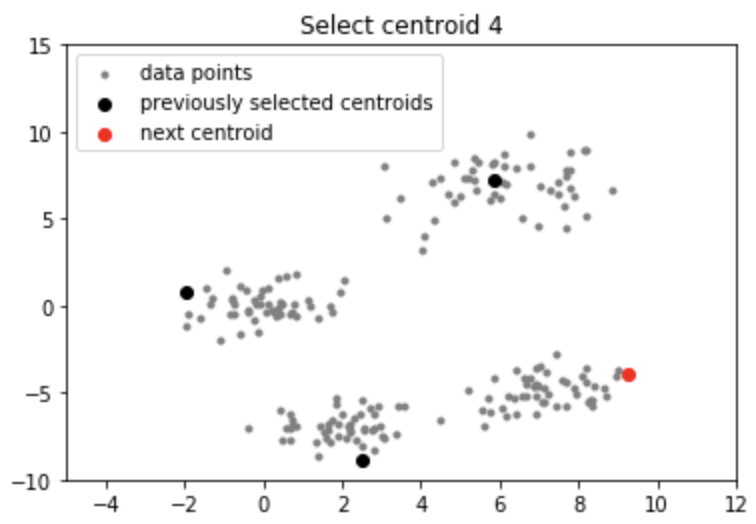
- Select the next centroid from the data points such that the probability of choosing a point as centroid is directly proportional to its distance from the nearest, previously chosen centroid. (i.e. the point having maximum distance from the nearest centroid is most likely to be selected next as a centroid)
- Repeat steps 2 and 3 until k centroids have been sampled
Intuition: By following the above procedure for initialization, we pick up centroids that are far away from one another. This increases the chances of initially picking up centroids that lie in different clusters. Also, since centroids are picked up from the data points, each centroid has some data points associated with it at the end.
Implementation:
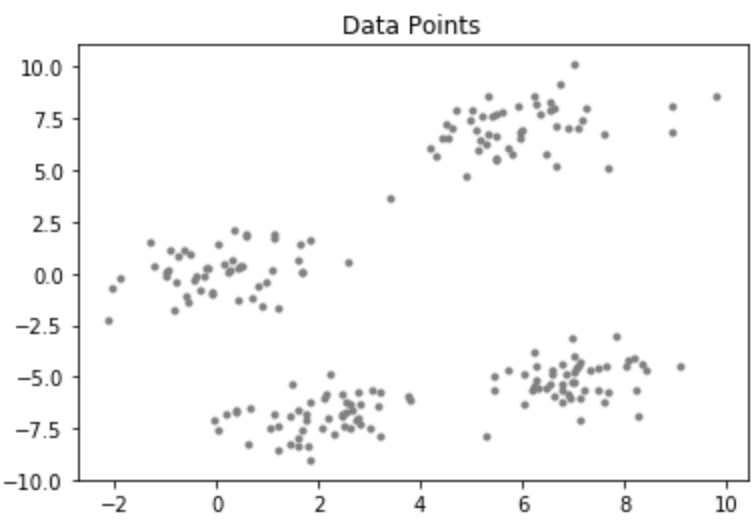
Consider a data-set having the following distribution:
Code: Python code for KMean++ Algorithm
Python3
# importing dependencies
import numpy as np
import pandas as pd
import matplotlib.pyplot as plt
import sys

# creating data
mean_01 = np.array([0.0, 0.0])
cov_01 = np.array([[1, 0.3], [0.3, 1]])
dist_01 = np.random.multivariate_normal(mean_01, cov_01, 100)

mean_02 = np.array([6.0, 7.0])
cov_02 = np.array([[1.5, 0.3], [0.3, 1]])
dist_02 = np.random.multivariate_normal(mean_02, cov_02, 100)

mean_03 = np.array([7.0, -5.0])
cov_03 = np.array([[1.2, 0.5],
                   [0.5, 1]])
dist_03 = np.random.multivariate_normal(mean_03, cov_01, 100)

mean_04 = np.array([2.0, -7.0])
cov_04 = np.array([[1.2, 0.5], [0.5, 1.3]])
dist_04 = np.random.multivariate_normal(mean_04, cov_01, 100)

data = np.vstack((dist_01, dist_02, dist_03, dist_04))
np.random.shuffle(data)

# function to plot the selected centroids


def plot(data, centroids):
    plt.scatter(data[:, 0], data[:, 1], marker='.',
                color='gray', label='data points')
    plt.scatter(centroids[:-1, 0], centroids[:-1, 1],
                color='black', label='previously selected centroids')
    plt.scatter(centroids[-1, 0], centroids[-1, 1],
                color='red', label='next centroid')
    plt.title('Select % d th centroid' % (centroids.shape[0]))

    plt.legend()
    plt.xlim(-5, 12)
    plt.ylim(-10, 15)
    plt.show()

# function to compute euclidean distance
def distance(p1, p2):
    return np.sqrt(np.sum((p1 - p2)**2))

# initialization algorithm
def initialize(data, k):
    '''
    initialized the centroids for K-means++
    inputs:
        data - numpy array of data points having shape (200, 2)
        k - number of clusters
    '''
    # initialize the centroids list and add
    # a randomly selected data point to the list
    centroids = []
    centroids.append(data[np.random.randint(
        data.shape[0]), :])
    plot(data, np.array(centroids))

    # compute remaining k - 1 centroids
    for c_id in range(k - 1):

        # initialize a list to store distances of data
        # points from nearest centroid
        dist = []
        for i in range(data.shape[0]):
            point = data[i, :]
            d = sys.maxsize

            # compute distance of 'point' from each of the previously
            # selected centroid and store the minimum distance
            for j in range(len(centroids)):
                temp_dist = distance(point, centroids[j])
                d = min(d, temp_dist)
            dist.append(d)

        # select data point with maximum distance as our next centroid
        dist = np.array(dist)
        next_centroid = data[np.argmax(dist), :]
        centroids.append(next_centroid)
        dist = []
        plot(data, np.array(centroids))
    return centroids


# call the initialize function to get the centroids
centroids = initialize(data, k=4)
Output:
Applications of k-means++ algorithm
- Image segmentation: K-means++ can be used to segment images into different regions based on their color or texture features. This is useful in computer vision applications, such as object recognition or tracking.
- Customer segmentation: K-means++ can be used to group customers into different segments based on their purchasing habits, demographic data, or other characteristics. This is useful in marketing and advertising applications, as it can help businesses target their marketing efforts more effectively.
- Anomaly detection: K-means++ can be used to identify outliers or anomalies in a dataset. This is useful in fraud detection, network intrusion detection, and other security applications.
- Document clustering: K-means++ can be used to group similar documents together based on their content. This is useful in natural language processing applications, such as text classification or sentiment analysis.
- Recommender systems: K-means++ can be used to recommend products or services to users based on their past purchases or preferences. This is useful in e-commerce and online advertising applications.
Note: Although the initialization in K-means++ is computationally more expensive than the standard K-means algorithm, the run-time for convergence to optimum is drastically reduced for K-means++. This is because the centroids that are initially chosen are likely to lie in different clusters already.
Share your thoughts in the comments
Please Login to comment...