Debugging in JavaScript
Last Updated :
15 May, 2023
In this article, we will learn about debugging in Javascript. Debugging is the term that means examining the code, finding the error in the code, and fixing that error.
It is common to have errors while writing codes and the errors can be due to syntax or logic. These errors create a lot of ambiguity in the logic and understanding of both users and programmers. There can also be errors in the code which can remain invisible to the programmer’s eye and can create havoc. To identify these errors we need Debuggers that can go through the entire code or program, identify the errors and also fix them.
Using debugger keyword: The debugger keyword is used in the code to force stop the execution of the code at a breaking point and calls the debugging function. The debugger function is executed if any debugging is needed at all else no action is performed.
Example: Let’s see the JavaScript program on debugging:
HTML
<!DOCTYPE html>
<html lang="en">
<head>
<title>Debugging in Javascript</title>
</head>
<body>
<h4>
Debugging demonstrations using Debugger keyword
</h4>
The solution of 20 * 5 is:
<p id="test"></p>
<p>
If the debugger is turned on the code stops
execution at the start of the debugger
</p>
<script>
const x = 20;
const y = 5;
const z = x * y;
debugger;
document.getElementById("test").innerHTML = z;
</script>
</body>
</html>
|
Output:
Previously implementing debuggers was tough but with time and with the advent of modern browsers, various built-in debuggers came into implementation. As previously mentioned the setting up of breakpoints breaks the line of code and flows the control to another area from where it is called. This can be done in the debugging window of the browser. Also setting up of breakpoints in javascript acts similar to the breakpoints in Java where the execution of the code stops and examination of the values is performed by the browser. One can resume the flow control after the examination is done. The debugging can be turned on or off depending upon the user’s convenience. This all can be done through the “Console” of the debugger menu.
Use of console.log() method: There is another way in which the JS values can be displayed in the debugger window.
Example: Let’s see the JavaScript program using console.log():
HTML
<!DOCTYPE html>
<html lang="en">
<head>
<title>Debugging in Javascript</title>
</head>
<body>
<h3>
GeeksforGeeks
</h3>
<h4>Hello Geek</h4>
<p>
1. To view the result activate debugging of your
browser(preferred the latest) by pressing F12 <br>
2. Select "Console" in the debugger menu.
</p>
<script>
x = "Where do you work?"
y = "I work at GeeksforGeeks"
console.log(x);
console.log(y);
</script>
</body>
</html>
|
Output:

Setting Break Points: The console.log() is a good way to debug errors but setting breakpoints is a faster, more efficient, and better method. In this method, Breakpoints are set in code which stops the execution of code at that point so that the values of variables can be examined at that time. Here are some advantages of using Breakpoints over the console.log() method:
- In the console.log() method user has to understand the code and manually put console.log() at points in the code. But in the breakpoints method, we can set breakpoints through the Developer tool anywhere in the code without even knowing it.
- In the console.log() method we have to manually print values of different variables but at a certain breakpoint, all the values of all variables are displayed automatically in the Developers tool. Enter the Developers tool section by pressing F12 key and go to sources. In the source section, select a javascript file and set breakpoints by either selecting from the provided list like DOM breakpoints or Event listener breakpoints which stop the execution of code whenever an event occurs
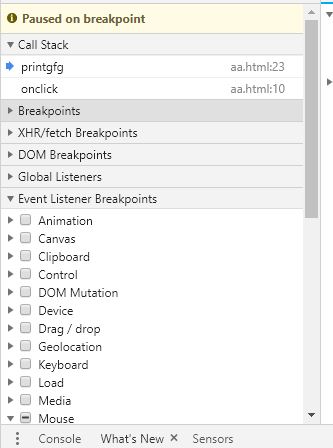
OR set a breakpoint by simply clicking the line number shown in the code. In the following image, a breakpoint is set at line 23. (The code used is the same as the above example)

As shown in the image, the code stopped at line 23 and showed all the values of variables in the code at that point in time. Since we can see the value of I was initially 1 and at the breakpoint, it is 5. Hence GeeksForGeeks was printed 5-1=4 times.
Share your thoughts in the comments
Please Login to comment...