While writing codes, It is a very common thing to get an error. The errors can be of many types like – logical errors, runtime errors, syntax errors, compilation errors, etc. Solving those errors is Debugging. Basically, Debugging is a part of the Software testing process which helps in evaluating and verifying errors.
CoffeeScript Debugging: CoffeeScript is a programming language that compiles JavaScript. This in short means that before sending it to the browser, it is compiled down to JavaScript.
It refers to the detection and removal of the bug or errors present in the code. In CoffeeScript Debugging, we need to understand that we can debug the compiled JavaScript version of the code instead of the original Coffeescript. One of the famous solutions to debugging is solved using source maps in JavaScript. This works best in the most recent versions of Google Chrome and other chromium websites.
What do Source Maps do? The Source Map(sets) in an IDE is generated in addition to JavaScript code which corresponds between the lines of CoffeeScript code and JavaScript code. If in some cases, it doesn’t happen the breakpoints cannot be acknowledged and computed properly. The generation of the Source Maps is done by compiling the CoffeeScript manually using the File Watcher(plugin) of the type CoffeeScript. This allows you to debug the output JavaScript code similar to it as if it were a Node.js application. This Debugging is only supported in local mode and can be done on the platforms like RubyMine, VsCode, etc.
Following are some methods for CoffeeScript Debugging: We have discussed two main methods for CoffeeScript Debugging:
Method 1: Using Node Inspector:
As we have discussed earlier, source maps help in troubleshooting CoffeeScript which is designed for the web. Now we will learn to debug CoffeeScript which is designed to run on the server. The steps for the same are:
Step 1: First of all, we will install the Node Inspector NPM Module. Node Inspector supports source maps out of the box, so no extra configuration is needed, we can start the debugging with the simple steps by using commands. The command for the installation is :
npm install -g node-inspector
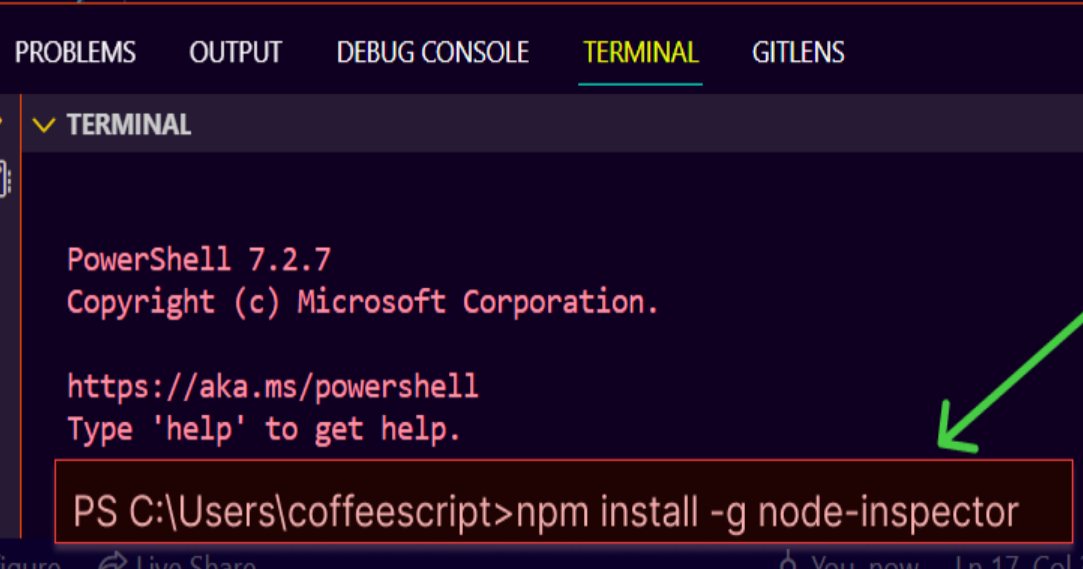
Command for Installing Node Inspector
Step 2: In order to compile the CoffeeScript code, to use the Node Inspector, we will use the coffee command. This will be helpful in debugging and generating the source map. Let’s understand this in-depth with an example of the simple source code in a file named geeks.coffee:
Javascript
for i in [1..15]
if i % 2 is 0
console.log "#{i} is a even!"
else
console.log "#{i} is a odd!"
|
Step 3: Now, we need to compile our CoffeeScript code in the JavaScript code. This is done because before sending the code to the browser, it is necessary to compile it in JavaScript. We will use the following command to compile our file to use the Node Inspector:
coffee -c -m geeks.coffee
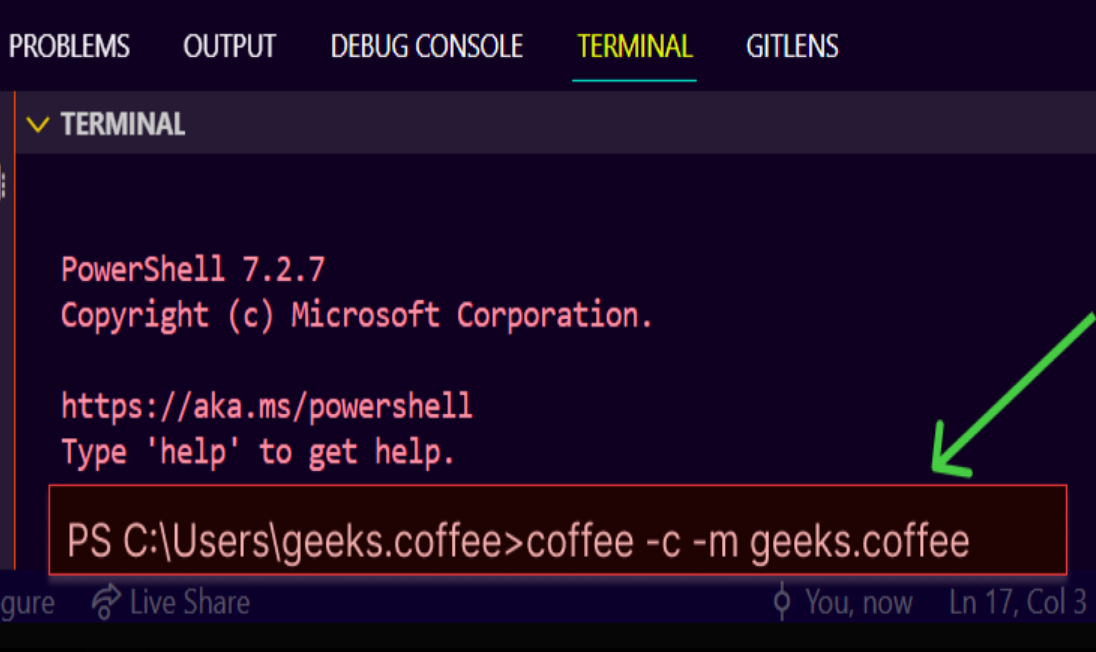
Command to compile the file.
Step 4: After compiling the CoffeeScript, we have to use the Node Inspector installed to debug our file. So, to launch the Node Inspector, we will use the following command:
node-debug geeks.js
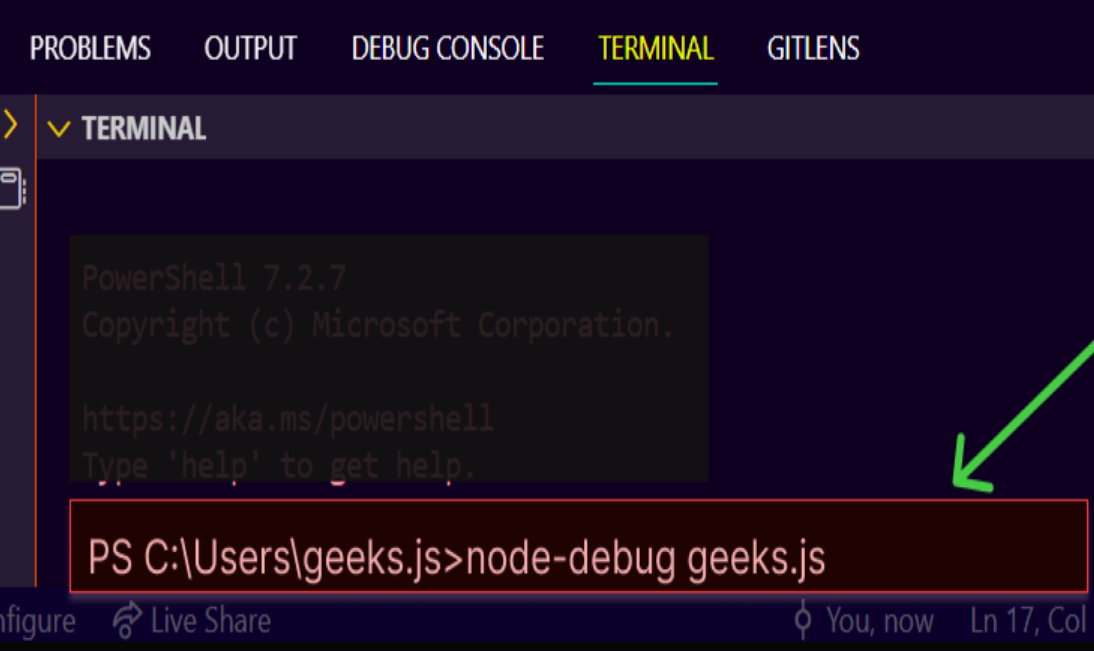
Launching the Node Inspector
Now, let’s discuss what next will happen. When we run Node Inspector, two things happen – 1st, it launches the Node debugger, and 2nd, it launches an HTTP handler. Node debugger is a debugging service/built-in service that comes with Node that allows us to step through code, hit line breaks, and evaluate variables. Launching the HTTP handler opens a browser that allows us to use Chrome’s built-in debugging tools to use breakpoints, step over and into code, and evaluate variables. We can see the output as a Chrome window with an active break point. In the local variables tool window on the right-hand side, we can see that the current value of i is 2:
Method 2: Debugging CoffeeScript Line-by-Line:
For compiling the CoffeeScript Line-by-Line, we have to set the breakpoints in the CoffeeScript code where necessary. To debug it we have to Compile the CoffeeScript code into Javascript using the File Watcher of the type CoffeeScript and create the Node.js run configuration. We need to follow the following steps:
Step 1: Let’s take an example. We will use a Coffeescript compiler that is packaged through npm (to compile the taken example). This will be our initial step of debugging. The most recent versions of Google Chrome and other chromium websites have native support for source maps. The example taken is given below:
Javascript
eat = (food) ->
console.log food
eat(food) for food in ['toast','cheese','wine'] when food isnt 'cheese'
|
Step 2: Our next step is to compile our source maps, so that, we will be able to set the breakpoints, step through code, hit line breaks, and evaluate variables Now, to compile the source maps, we should pass the -m flag.
coffee -cm geeks.coffee

Compiling the Source Maps
Step 3: The above commands (compiling the source maps) will result in creating two files – geeks.js and geeks.map . For less difficulty, the compiler would provide a comment in the JavaScript file(geeks.js) to indicate to the browser where to find the source map file.
/*
//@ sourceMappingURL=geeks.map
*/
Step 4: Now, our next task is the loading of our JavaScript file(in other words, compiled CoffeeScript file). To load it , create an HTML file( and load the JavaScript file into it).
HTML
<html>
<head>
<script type='text/javascript' src='geeks.js'></script>
</head>
<body>
<h1>CoffeeScript Debugging</h1>
</body>
</html>
|
Step 5: Now, we have come to an end in debugging the CoffeeScript. The last step is to enable source maps in Google Chrome. For this, open up the developer tools and look for the settings icon in the bottom right.

Enable Source Maps in Google Chrome.
Our compilation and debugging of the CoffeeScript are almost completed. Now if we look into sources, we are able to see our CoffeeScript file and be able to add breakpoints, hover to view variables, step through code, hit line breaks, evaluate variables, etc.
We have seen two very effective methods of debugging CoffeeScript. The problem of debugging CoffeeScript, the most popular and strongest argument for not using it in the browser, has been solved using these methods. Our CoffeeScript is debugged!
Like Article
Suggest improvement
Share your thoughts in the comments
Please Login to comment...