What are Some Common Debugging Techniques for JavaScript ?
Last Updated :
22 Mar, 2024
JavaScript development can be tricky, and errors are common. But do not worry! There are ways to find and fix these problems.
Some of the common methods to debug JavaScript code are listed below:
Using console.log()
If you want to see messages or check the values of variables while your code is running, you can use console.log(). This function will print out whatever you specify to the console in your web browser. It’s a handy way to keep track of what’s happening in your code and see the values of different things as your program runs.
Syntax:
 console.log("message");
                 OR
console.log(variableName);
Example: The below code will explain the use of the console.log() to debug your JavaScript code.
JavaScript
let age = 30;
console.log("Age is: " + age);
Error Handling (try…catch blocks):
When something unexpected goes wrong in your code, handle it carefully to prevent your program from crashing. You can show helpful messages to users, record the errors for later, and offer alternative solutions to keep things running smoothly.
Example: The below code implements the try/catch block in JavaScript to debug the code.
JavaScript
try {
    let result = JSON.parse(invalidJSONString);
    console.log(result);
} catch (error) {
    console.error("Error parsing JSON:", error.message);
}
Output:
Error parsing JSON: invalidJSONString is not defined.
If you are having trouble with your code and need to take a closer look, you can use the debugger tool in your browser’s developer tools. This tool lets you stop the code from running at a specific line so you can check what’s going on. You can then look at the values of different things in your code and see how your program is working. It’s like hitting a pause button to investigate what’s happening in your code.
The stepwise approach to use debugger and the developer tools is written below:
Step 1: Imagine you have a webpage with a JavaScript bug and open the developer tools (F12).
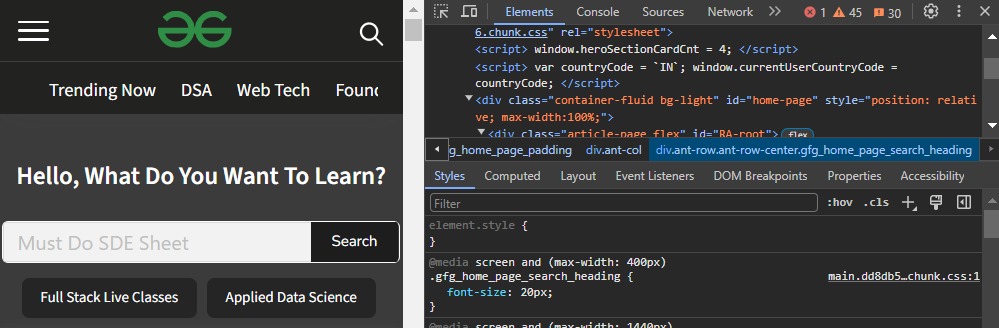
Opening DevTools
Step 2: In the “Sources” panel, you can see all the JS files of the site.
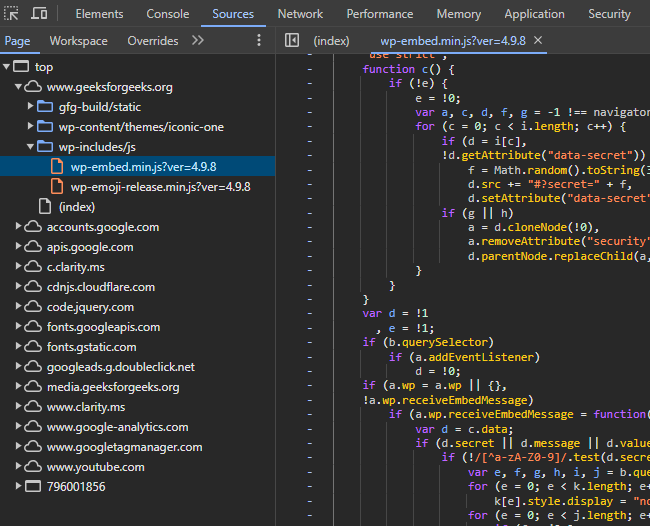
Opening a JS file in Sources Tab
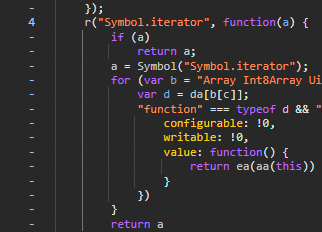
Step 3: You suspect the bug lest say is line 4, so you click on the line number 4 to set a breakpoint.
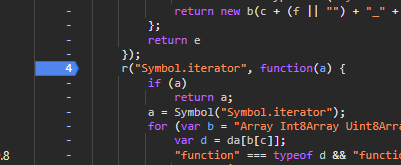
Clicking the line no. to add breakpoint
Step 4: You refresh the webpage, and the browser pauses right before executing line 4 (due to the breakpoint).
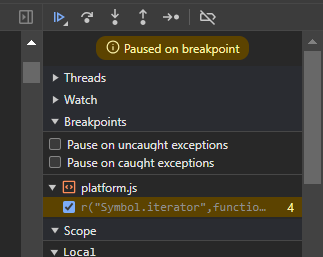
The browser paused the execution and fill the sidebar
Step 5: The “Scope” pane shows you the values of variables used on line 4. You see an unexpected value and identify the root cause of the bug.
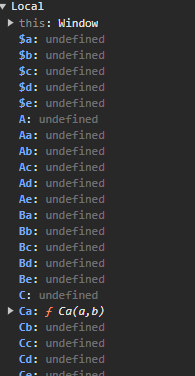
All variables used in that block
Step 6: You will find various options in the right sidebar in the Sources tab to step through the code and, examining the variables value at each step.
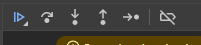
Debugger Buttons
Step 7: Once you understand the issue, you remove the breakpoint and resume execution to test your fix.
Clicking the line no. to remove breakpoint
Share your thoughts in the comments
Please Login to comment...