Missing values are a common issue in machine learning. This occurs when a particular variable lacks data points, resulting in incomplete information and potentially harming the accuracy and dependability of your models. It is essential to address missing values efficiently to ensure strong and impartial results in your machine-learning projects. In this article, we will see How to Handle Missing Values in Datasets in Machine Learning.
What is a Missing Value?
Missing values are data points that are absent for a specific variable in a dataset. They can be represented in various ways, such as blank cells, null values, or special symbols like “NA” or “unknown.” These missing data points pose a significant challenge in data analysis and can lead to inaccurate or biased results.
Missing Values
Missing values can pose a significant challenge in data analysis, as they can:
- Reduce the sample size: This can decrease the accuracy and reliability of your analysis.
- Introduce bias: If the missing data is not handled properly, it can bias the results of your analysis.
- Make it difficult to perform certain analyses: Some statistical techniques require complete data for all variables, making them inapplicable when missing values are present
Why Is Data Missing From the Dataset?
Data can be missing for many reasons like technical issues, human errors, privacy concerns, data processing issues, or the nature of the variable itself. Understanding the cause of missing data helps choose appropriate handling strategies and ensure the quality of your analysis.
It’s important to understand the reasons behind missing data:
- Identifying the type of missing data: Is it Missing Completely at Random (MCAR), Missing at Random (MAR), or Missing Not at Random (MNAR)?
- Evaluating the impact of missing data: Is the missingness causing bias or affecting the analysis?
- Choosing appropriate handling strategies: Different techniques are suitable for different types of missing data.
Types of Missing Values
There are three main types of missing values:
- Missing Completely at Random (MCAR): MCAR is a specific type of missing data in which the probability of a data point being missing is entirely random and independent of any other variable in the dataset. In simpler terms, whether a value is missing or not has nothing to do with the values of other variables or the characteristics of the data point itself.
- Missing at Random (MAR): MAR is a type of missing data where the probability of a data point missing depends on the values of other variables in the dataset, but not on the missing variable itself. This means that the missingness mechanism is not entirely random, but it can be predicted based on the available information.
- Missing Not at Random (MNAR): MNAR is the most challenging type of missing data to deal with. It occurs when the probability of a data point being missing is related to the missing value itself. This means that the reason for the missing data is informative and directly associated with the variable that is missing.
Methods for Identifying Missing Data
Locating and understanding patterns of missingness in the dataset is an important step in addressing its impact on analysis. Working with Missing Data in Pandas there are several useful functions for detecting, removing, and replacing null values in Pandas DataFrame.
|
.isnull()
|
Identifies missing values in a Series or DataFrame.
|
|
.notnull()
|
check for missing values in a pandas Series or DataFrame. It returns a boolean Series or DataFrame, where True indicates non-missing values and False indicates missing values.
|
|
.info()
|
Displays information about the DataFrame, including data types, memory usage, and presence of missing values.
|
|
.isna()
|
similar to notnull() but returns True for missing values and False for non-missing values.
|
dropna() |
Drops rows or columns containing missing values based on custom criteria. |
fillna() |
Fills missing values with specific values, means, medians, or other calculated values. |
replace() |
Replaces specific values with other values, facilitating data correction and standardization. |
drop_duplicates() |
Removes duplicate rows based on specified columns. |
unique() |
Finds unique values in a Series or DataFrame. |
How Is a Missing Value Represented in a Dataset?
Missing values can be represented by blank cells, specific values like “NA”, or codes. It’s important to use consistent and documented representation to ensure transparency and facilitate data handling.
Common Representations
- Blank cells: Empty cells in spreadsheets or databases often signify missing data.
- Specific values: Special values like “NULL”, “NA”, or “-999” are used to represent missing data explicitly.
- Codes or flags: Non-numeric codes or flags can be used to indicate different types of missing values.
Effective Strategies for Handling Missing Values in Data Analysis
Missing values are a common challenge in data analysis, and there are several strategies for handling them. Here’s an overview of some common approaches:
Creating a Sample Dataframe
Python3
import pandas as pd
import numpy as np
data = {
'School ID': [101, 102, 103, np.nan, 105, 106, 107, 108],
'Name': ['Alice', 'Bob', 'Charlie', 'David', 'Eva', 'Frank', 'Grace', 'Henry'],
'Address': ['123 Main St', '456 Oak Ave', '789 Pine Ln', '101 Elm St', np.nan, '222 Maple Rd', '444 Cedar Blvd', '555 Birch Dr'],
'City': ['Los Angeles', 'New York', 'Houston', 'Los Angeles', 'Miami', np.nan, 'Houston', 'New York'],
'Subject': ['Math', 'English', 'Science', 'Math', 'History', 'Math', 'Science', 'English'],
'Marks': [85, 92, 78, 89, np.nan, 95, 80, 88],
'Rank': [2, 1, 4, 3, 8, 1, 5, 3],
'Grade': ['B', 'A', 'C', 'B', 'D', 'A', 'C', 'B']
}
df = pd.DataFrame(data)
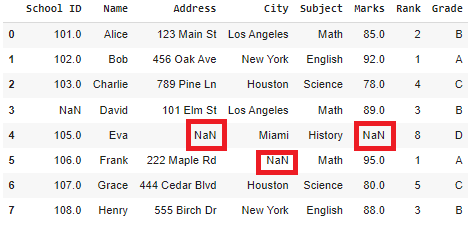
print("Sample DataFrame:")
print(df)
|
Output:
Sample Dataframe:
   School ID     Name         Address         City  Subject  Marks  Rank Grade
0      101.0    Alice     123 Main St  Los Angeles     Math   85.0     2     B
1      102.0      Bob     456 Oak Ave     New York  English   92.0     1     A
2      103.0  Charlie     789 Pine Ln      Houston  Science   78.0     4     C
3        NaN    David      101 Elm St  Los Angeles     Math   89.0     3     B
4      105.0      Eva             NaN        Miami  History    NaN     8     D
5      106.0    Frank    222 Maple Rd          NaN     Math   95.0     1     A
6      107.0    Grace  444 Cedar Blvd      Houston  Science   80.0     5     C
7      108.0    Henry    555 Birch Dr     New York  English   88.0     3     B
Removing Rows with Missing Values
- Simple and efficient: Removes data points with missing values altogether.
- Reduces sample size: Can lead to biased results if missingness is not random.
- Not recommended for large datasets: Can discard valuable information.
In this example, we are removing rows with missing values from the original DataFrame (df) using the dropna() method and then displaying the cleaned DataFrame (df_cleaned).
Python3
df_cleaned = df.dropna()
print("\nDataFrame after removing rows with missing values:")
print(df_cleaned)
|
Output:
DataFrame after removing rows with missing values:
   School ID     Name         Address         City  Subject  Marks  Rank Grade
0      101.0    Alice     123 Main St  Los Angeles     Math   85.0     2     B
1      102.0      Bob     456 Oak Ave     New York  English   92.0     1     A
2      103.0  Charlie     789 Pine Ln      Houston  Science   78.0     4     C
6      107.0    Grace  444 Cedar Blvd      Houston  Science   80.0     5     C
7      108.0    Henry    555 Birch Dr     New York  English   88.0     3     B
Imputation Methods
- Replacing missing values with estimated values.
- Preserves sample size: Doesn’t reduce data points.
- Can introduce bias: Estimated values might not be accurate.
Here are some common imputation methods:
1- Mean, Median, and Mode Imputation:
- Replace missing values with the mean, median, or mode of the relevant variable.
- Simple and efficient: Easy to implement.
- Can be inaccurate: Doesn’t consider the relationships between variables.
In this example, we are explaining the imputation techniques for handling missing values in the ‘Marks’ column of the DataFrame (df). It calculates and fills missing values with the mean, median, and mode of the existing values in that column, and then prints the results for observation.
- Mean Imputation: Calculates the mean of the ‘Marks’ column in the DataFrame (
df).
df['Marks'].fillna(...): Fills missing values in the ‘Marks’ column with the mean value.mean_imputation: The result is stored in the variable mean_imputation.
- Median Imputation: Calculates the median of the ‘Marks’ column in the DataFrame (
df).
df['Marks'].fillna(...): Fills missing values in the ‘Marks’ column with the median value.median_imputation: The result is stored in the variable median_imputation.
- Mode Imputation: Calculates the mode of the ‘Marks’ column in the DataFrame (
df). The result is a Series.
.iloc[0]: Accesses the first element of the Series, which represents the mode.df['Marks'].fillna(...): Fills missing values in the ‘Marks’ column with the mode value.
Python3
mean_imputation = df['Marks'].fillna(df['Marks'].mean())
median_imputation = df['Marks'].fillna(df['Marks'].median())
mode_imputation = df['Marks'].fillna(df['Marks'].mode().iloc[0])
print("\nImputation using Mean:")
print(mean_imputation)
print("\nImputation using Median:")
print(median_imputation)
print("\nImputation using Mode:")
print(mode_imputation)
|
Output:
Imputation using Mean:
0    85.000000
1    92.000000
2    78.000000
3    89.000000
4    86.714286
5    95.000000
6    80.000000
7    88.000000
Name: Marks, dtype: float64

Imputation using Median:
0    85.0
1    92.0
2    78.0
3    89.0
4    88.0
5    95.0
6    80.0
7    88.0
Name: Marks, dtype: float64

Imputation using Mode:
0    85.0
1    92.0
2    78.0
3    89.0
4    78.0
5    95.0
6    80.0
7    88.0
Name: Marks, dtype: float64
2. Forward and Backward Fill
- Replace missing values with the previous or next non-missing value in the same variable.
- Simple and intuitive: Preserves temporal order.
- Can be inaccurate: Assumes missing values are close to observed values
These fill methods are particularly useful when there is a logical sequence or order in the data, and missing values can be reasonably assumed to follow a pattern. The method parameter in fillna() allows to specify the filling strategy, and here, it’s set to ‘ffill’ for forward fill and ‘bfill’ for backward fill.
- Forward Fill (
forward_fill)
df['Marks'].fillna(method='ffill'): This method fills missing values in the ‘Marks’ column of the DataFrame (df) using a forward fill strategy. It replaces missing values with the last observed non-missing value in the column.forward_fill: The result is stored in the variable forward_fill.
- Backward Fill (
backward_fill)
df['Marks'].fillna(method='bfill'): This method fills missing values in the ‘Marks’ column using a backward fill strategy. It replaces missing values with the next observed non-missing value in the column.backward_fill: The result is stored in the variable backward_fill.
Python3
forward_fill = df['Marks'].fillna(method='ffill')
backward_fill = df['Marks'].fillna(method='bfill')
print("\nForward Fill:")
print(forward_fill)
print("\nBackward Fill:")
print(backward_fill)
|
Output:
Forward Fill:
0    85.0
1    92.0
2    78.0
3    89.0
4    89.0
5    95.0
6    80.0
7    88.0
Name: Marks, dtype: float64

Backward Fill:
0    85.0
1    92.0
2    78.0
3    89.0
4    95.0
5    95.0
6    80.0
7    88.0
Name: Marks, dtype: float64
Note
- Forward fill uses the last valid observation to fill missing values.
- Backward fill uses the next valid observation to fill missing values.
3. Interpolation Techniques
- Estimate missing values based on surrounding data points using techniques like linear interpolation or spline interpolation.
- More sophisticated than mean/median imputation: Captures relationships between variables.
- Requires additional libraries and computational resources.
These interpolation techniques are useful when the relationship between data points can be reasonably assumed to follow a linear or quadratic pattern. The method parameter in the interpolate() method allows to specify the interpolation strategy.
- Linear Interpolation
df['Marks'].interpolate(method='linear'): This method performs linear interpolation on the ‘Marks’ column of the DataFrame (df). Linear interpolation estimates missing values by considering a straight line between two adjacent non-missing values.linear_interpolation: The result is stored in the variable linear_interpolation.
- Quadratic Interpolation
df['Marks'].interpolate(method='quadratic'): This method performs quadratic interpolation on the ‘Marks’ column. Quadratic interpolation estimates missing values by considering a quadratic curve that passes through three adjacent non-missing values.quadratic_interpolation: The result is stored in the variable quadratic_interpolation.
Python3
linear_interpolation = df['Marks'].interpolate(method='linear')
quadratic_interpolation = df['Marks'].interpolate(method='quadratic')
print("\nLinear Interpolation:")
print(linear_interpolation)
print("\nQuadratic Interpolation:")
print(quadratic_interpolation)
|
Output:
Linear Interpolation:
0    85.0
1    92.0
2    78.0
3    89.0
4    92.0
5    95.0
6    80.0
7    88.0
Name: Marks, dtype: float64

Quadratic Interpolation:
0    85.00000
1    92.00000
2    78.00000
3    89.00000
4    98.28024
5    95.00000
6    80.00000
7    88.00000
Name: Marks, dtype: float64
Note:
- Linear interpolation assumes a straight line between two adjacent non-missing values.
- Quadratic interpolation assumes a quadratic curve that passes through three adjacent non-missing values.
Choosing the right strategy depends on several factors:
- Type of missing data: MCAR, MAR, or MNAR.
- Proportion of missing values.
- Data type and distribution.
- Analytical goals and assumptions.
Impact of Handling Missing Values
Missing values are a common occurrence in real-world data, negatively impacting data analysis and modeling if not addressed properly. Handling missing values effectively is crucial to ensure the accuracy and reliability of your findings.
Here are some key impacts of handling missing values:
- Improved data quality: Addressing missing values enhances the overall quality of the dataset. A cleaner dataset with fewer missing values is more reliable for analysis and model training.
- Enhanced model performance: Machine learning algorithms often struggle with missing data, leading to biased and unreliable results. By appropriately handling missing values, models can be trained on a more complete dataset, leading to improved performance and accuracy.
- Preservation of Data Integrity: Handling missing values helps maintain the integrity of the dataset. Imputing or removing missing values ensures that the dataset remains consistent and suitable for analysis.
- Reduced bias: Ignoring missing values may introduce bias in the analysis or modeling process. Handling missing data allows for a more unbiased representation of the underlying patterns in the data.
- Descriptive statistics, such as means, medians, and standard deviations, can be more accurate when missing values are appropriately handled. This ensures a more reliable summary of the dataset.
- Increased efficiency: Efficiently handling missing values can save you time and effort during data analysis and modeling.
Conclusion
Handling missing values requires careful consideration and a tailored approach based on the specific characteristics of your data. By understanding the different types and causes of missing values, exploring various imputation techniques and best practices, and evaluating the impact of your chosen strategy, you can confidently address this challenge and optimize your machine learning pipeline for success
Frequently Asked Question(FAQs)
1. How do you handle missing values in ML?
It depends on the type and amount of missing data, as well as your analysis goals. Common techniques include removing rows/columns, imputation (mean, median, model-based), weighting, and selection models.
2. What are the 4 techniques to handle missing values in time series data?
- Last observation carried forward (LOCF): Replace missing values with the last observed value.
- Next observation carried backward (NOCB): Replace missing values with the next observed value.
- Linear interpolation: Estimate missing values based on the trend between surrounding data points.
- Exponential smoothing: Use a weighted average of past values to estimate missing values.
3. What is a method for handling missing data?
- Mean imputation: Replace missing values with the mean of the variable.
- Median imputation: Replace missing values with the median of the variable.
- Mode imputation: Replace missing values with the most frequent value of the variable.
- K-Nearest Neighbors (KNN): Impute missing values based on the values of the K nearest neighbors.
4. How do you predict missing values in a machine learning model?
- Train a model to predict the missing values based on other features in the data. This can be done using techniques like regression, decision trees, or neural networks.
- Use a specialized model designed for handling missing data, such as a missing value imputer.
- Combine multiple imputation techniques together to improve accuracy.
Share your thoughts in the comments
Please Login to comment...