Sampling distribution Using Python
Last Updated :
26 Oct, 2022
There are different types of distributions that we study in statistics like normal/gaussian distribution, exponential distribution, binomial distribution, and many others. We will study one such distribution today which is Sampling Distribution.
Let’s say we have some data then if we sample some finite number of data points from it and then calculate some statistical measure of it and let’s do this some n number of times. Then if we draw the distribution curve of those sample statistics then the distribution obtained is known as Sampling Distribution.
Sampling distribution Using Python
There is also a special case of the sampling distribution which is known as the Central Limit Theorem which says that if we take some samples from a distribution of data(no matter how it is distributed) then if we draw a distribution curve of the mean of those samples then it will be a normal distribution.
Let’s understand it by using an example:
Let’s take numbers from 1 to 10 and use them as our primary data.
Python3
import numpy as np
num = np.arange(10)
num
|
Output:
array([0, 1, 2, 3, 4, 5, 6, 7, 8, 9])
Now, let’s sample two points from the data and take the average of these two. Also, let’s maintain a dictionary with the sample means and the number of times they appear.
Python3
sample_freq = {}
for i in range(4):
for j in range(4):
mean_of_two = (num[i] + num[j]) / 2
if (mean_of_two in sample_freq):
sample_freq[mean_of_two] += 1
else:
sample_freq[mean_of_two] = 1
sample_freq
|
Output:
{1.0: 1, 1.5: 2, 2.0: 3, 2.5: 4, 3.0: 3, 3.5: 2, 4.0: 1}
Now, let’s plot the sample statistics to visualize its distribution.
Python3
import matplotlib.pyplot as plt
plt.scatter(sample_freq.keys(), sample_freq.values())
plt.show()
|
Output:
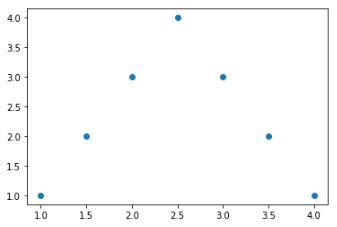
Distribution of the sample statistic
From the above graph, we can observe that the distribution of the sample statistic is symmetric and if we will take infinite such points which are totally random then we’ll be able to observe that the distribution formed will be a normal/gaussian distribution.
There are some error measurements that are related to the sampling distributions:
Standard Error
Let’s say we have a sampling distribution that has been calculated using some sample statistics then the SE of that statistics is calculated by dividing the standard deviation of those statistics by the square root of the sample size.


Python3
means = []
for key in sample_freq.keys():
for _ in range(sample_freq[key]):
means.append(key)
se = np.std(means)/np.sqrt(len(means))
print(f'Standard Error of the samples is {se}.')
|
Output:
Standard Error of the samples is 0.19764235376052372.
Share your thoughts in the comments
Please Login to comment...