How to Use JupyterLab Inline Interactive Plots
Last Updated :
27 Sep, 2023
This article shows how to create inline interactive plots in JupyterLab with Python-3 programming language. It assumes basic familiarity with JupyterLab/Jupyter Notebooks and Python-3. By the end of the article, the reader will be able to understand and create inline interactive plots with Matplotlib, Bokeh, and Plotly plotting libraries inside a Jupyter-Notebook (in JupyterLab) using Python-3.
JupyterLab Inline Interactive Plots
JupyterLab is an open-source, web-based IDE (Integrated Development Environment) for working with Jupyter-Notebooks, data and data analysis. It allows working with R, Python, and Markdown among other languages to cater to the various needs of its users. This article focuses on creating interactive inline plots with Python-3 in a Jupyter Notebook inside JupyterLab.
A Jupyter notebook is composed of cells that can contain code (like Python code) or information (like some text created using markdown). When a cell containing code to output a graph/plot is executed, JupyterLab either shows it in a new window outside the notebook or shows it inside the notebook between the cells. The output between the cells is called an inline plot. An example is shown in the figure below.

Figure 1: Screenshot showing an inline plot in a jupyter notebook.
The plot in the image above is static/non-interactive. But sometimes we need to interact with the plot with actions like zoom, pan, etc. A plot which allows these actions is called an interactive plot. If such an interactive plot is placed between the cells of a jupyter notebook, it is now an inline interactive plot.
We start with the installation and setup of JupyterLab on a personal computer system and then proceed to create inline interactive plots with Matplotlib, Plotly and Bokeh in order.
Setup JupyterLab
Install python-3 interpreter on your system (if not installed already) and make sure that the interpreter is accessible from anywhere in your system by adding it to path system variable. Then use the following command on the terminal/command-prompt to install JupyterLab using pip (the python package manager) –
On Windows
py -m pip install --upgrade jupyterlab
On Linux
python3 -m pip install --upgrade jupyterlab
Once installed, execute the following command on the terminal/command-prompt to open JupyterLab –
On Windows
py -m jupyterlab
On Linux
python3 -m jupyterlab
A tab with JupyterLab will be launched in the browser. Create an ipython/jupyter-notebook using the launcher to begin working. You may try executing some simple python program like print(“Hello world”) in a cell to ensure everything is up and running. Now let us proceed with creating inline interactive plots in our jupyter-notebook.
Inline Interactive Plots with Matplotlib
Ensure that the matplotlib and ipympl are installed on your system with the following command –
On Windows
py -m pip install --upgrade matplotlib ipympl
On Linux
python3 -m pip install --upgrade matplotlib ipympl
ipympl is required to create inline interactive plots in jupyter-notebooks with matplotlib. Include the following line of code at the beginning of the cell whose output is wanted interactive –
%matplotlib widget
Example
Python3
%matplotlib widget
import matplotlib.pyplot as plt
x = [1,2,3]
y = [5,2,3]
plt.plot(x,y)
plt.show()
|
Output:
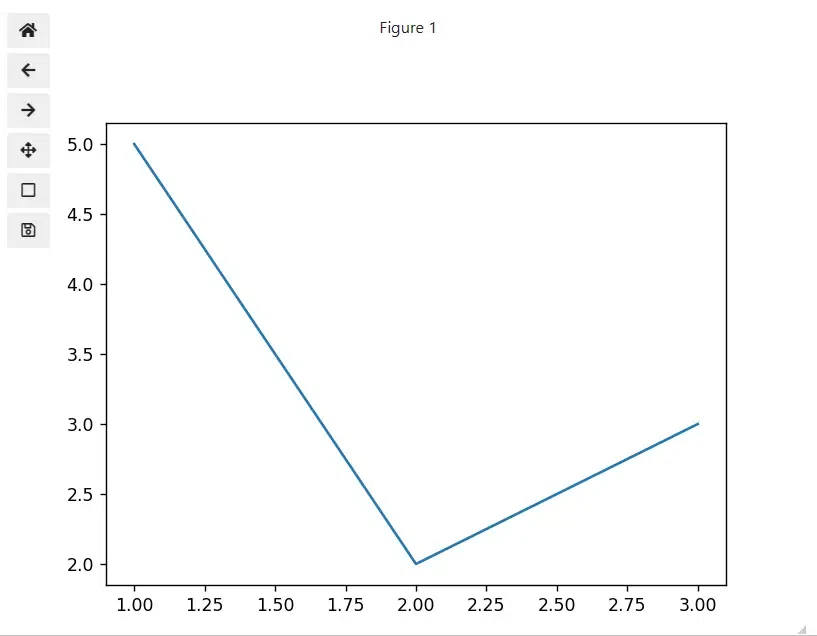
Inline Interactive Plots
The interactive controls can be seen at the top left corner in Figure 2.
Inline Interactive Plots with Plotly
Ensure latest version of Plotly is installed on your system with following command –
On Windows
py -m pip install --upgrade plotly
On Linux
python3 -m pip install --upgrade plotly
The method and code here is tested on plotly version 5.16.1.
To make inline interactive plot with plotly, add all the graph objects in a list and then pass this list to the iplot() function from plotly.offline as shown in the following example code –
Python3
import plotly.graph_objects as go
from plotly.offline import iplot
data = [go.Line(x=[1,2,3],
y=[10, 5, 9]),
go.Bar(x = [1,2,3],
y = [10, 5, 9])]
iplot(data)
|
Output:
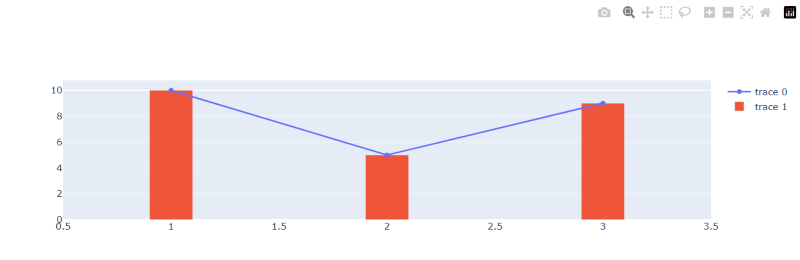
Figure 3: Inline Interactive Plotly Plot
The interactive controls can be seen at the top right corner in Figure 3.
Inline Interactive Plots with Bokeh
Ensure the latest version of Bokeh is installed on your system with the following command –
On Windows
py -m pip install --upgrade bokeh
On Linux
python3 -m pip install --upgrade bokeh
To make the bokeh plots inline and interactive inside a jupyter-notebook, we can use output_notebook() and show() functions from the bokeh.io. The output_notebook() function directs the notebook to show the plot inline and show() is used to output the interactive plot. The rest is general bokeh code. This is demonstrated in the following example –
Python3
from bokeh.io import output_notebook, show
from bokeh.plotting import figure, output_file
output_notebook()
graph = figure(title = "Bokeh Line Graph")
x = [1, 2, 3]
y = [4,2,5]
graph.line(x, y)
show(graph)
|
Output:

The interactive controls can be seen at the top right corner of the plot.
Share your thoughts in the comments
Please Login to comment...