Dynamically Updating Plot In Matplotlib
Last Updated :
27 Oct, 2023
This article shows how to dynamically update a Matplotlib (a data visualization library for Python programming language) plot as the data changes. It provides two methods to plot – first the API (useful for large programs and/or ones requiring deep control) and second the Pyplot interface (inspired by Matlab). In this article, we will show how to update the plot dynamically in a Pyplot environment.
Plotting a line graph with Matplotlib Pyplot
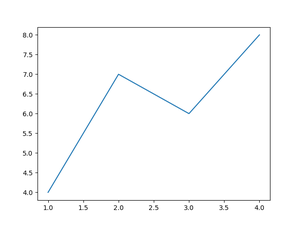
Before creating a dynamically updating graph, let’s first create/plot a simple static line graph using Matplotlib. This graph will later be upgraded to update dynamically with data. Here is a program to create a static line graph using Matplotlib –
Python
import matplotlib.pyplot as plt
x = [1,2,3,4]
y = [4,7,6,8]
graph = plt.plot(x,y)
plt.show()
|
Output:

A static matplotlib line plot/graph.
Dynamically Updating a Plot in Matplotlib
Here, we’ll look over multiple ways of updating a plot using Matplotlib:
- Using FuncAnimation Package
- Using pyplot interactive mode
- Using Figure.canvas.draw function
Updating a Matplotlib plot using matplotlib animations package (FuncAnimation)
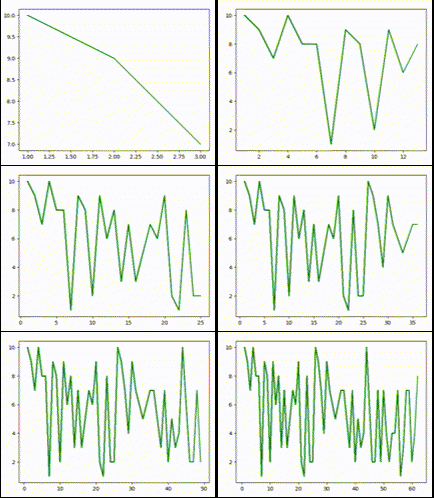
We can use the “matplotlib.animations.FuncAnimation” function to update a plot. First, Import the function using “from matplotlib.animations import FuncAnimation”. Initialize the data for the first frame (at least). Plot the first frame. Define a function (say update) that takes frame number as input and creates a new frame. It updates the data every time it is executed and then plots the new plot accordingly. Call the FuncAnimation function. In arguments, pass the above defined function as the function and frames = None (in this case, a frame is automatically provided). Call the matplotlib.show() method.
Python3
from matplotlib.animation import FuncAnimation
import matplotlib.pyplot as plt
import random
x = [1]
y = [random.randint(1,10)]
fig, ax = plt.subplots()
graph = ax.plot(x,y,color = 'g')[0]
plt.ylim(0,10)
def update(frame):
global graph
x.append(x[-1] + 1)
y.append(random.randint(1,10))
graph.set_xdata(x)
graph.set_ydata(y)
plt.xlim(x[0], x[-1])
anim = FuncAnimation(fig, update, frames = None)
plt.show()
|
Output:

Updating a Matplotlib plot using pyplot interactive mode
By default the interactive mode is off and as a result the plot is drawn only when the show function is called. Moreover, the execution is halt at the show function until the figure is closed. We can however turn the interactive mode on by calling the function <pyplot-object>.ion(). When the interactive mode is on, figure is drawn instantly and updated as soon as we make any changes to it. We can use this behavior to update the plot dynamically using the following approach –
The graph keeps on updating as long as the loop keeps on running. It is important to call the pause function to ensure that all the changes up to the pause function are completed before proceeding further.
Python3
import matplotlib.pyplot as plt
import random
plt.ion()
y = [random.randint(1,10) for i in range(20)]
x = [*range(1,21)]
graph = plt.plot(x,y)[0]
plt.ylim(0,10)
plt.pause(1)
while(True):
y.append(random.randint(1,10))
x.append(x[-1]+1)
graph.remove()
graph = plt.plot(x,y,color = 'g')[0]
plt.xlim(x[0], x[-1])
plt.pause(0.25)
|
Output:

Example of Matplotlib updating a scatter plot
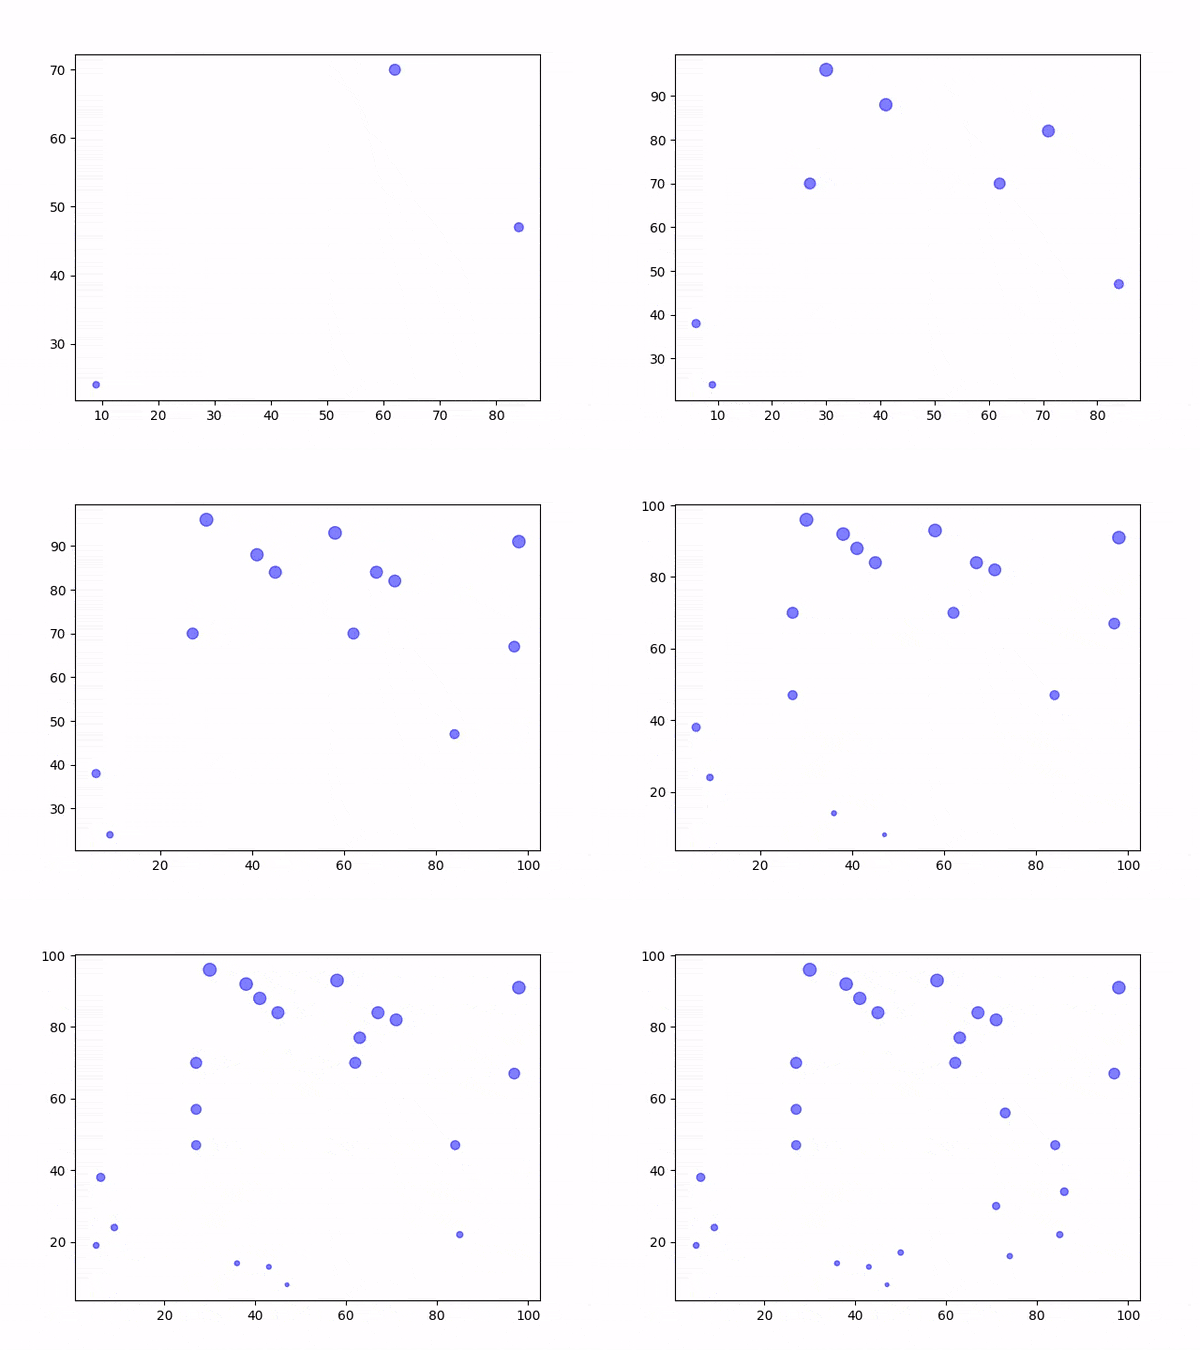
In this example, we are updating a matplotlib scatter-chart by using “Figure.canvas.draw()” function. Create the initial data (coordinates for one point). Define the update function which updates the data, then clears the axes, creates new graph based on the updated data and finally forces the artist to redraw using “figure.canvas.draw()” method. Here we update the data by adding the coordinates of a new scatter point to it. Call the FuncAnimation() function and pass the figure object and the update function to it. Call the plt.show() method to launch the figure.
Python3
import matplotlib.pyplot as plt
from matplotlib.animation import FuncAnimation
import random
x = [random.randint(1,100)]
y = [random.randint(1,100)]
fig, ax = plt.subplots()
def update(frame):
x.append(random.randint(1,100))
y.append(random.randint(1,100))
ax.clear()
ax.scatter(x,y, s = y, c = 'b', alpha = 0.5)
fig.canvas.draw()
anim = FuncAnimation(fig, update)
plt.show()
|
Output:

Conclusion
There are at least three methods to accomplish the task of updating a plot dynamically in matplotlib – First using matplotlib animations’ FuncAnimation function where and update function is defined which updates data and the graph at every frame, second using the matplotlib interactive mode which makes use of the fact that images are updated instantly in interactive mode by creating an update loop where data is updated, and graph renewed at every cycle and finally the third using the “figure.canvas.draw()” method after every update to force the artist of current axes to redraw the figure after update.
Share your thoughts in the comments
Please Login to comment...