Debugger Tool in Mozilla Firefox Browser
Last Updated :
16 Oct, 2023
Firefox provides a debugger in the DevTools to examine the JS code of the web page to inspect or find various bugs. You can add breakpoints to control the flow of execution and inspect various variables. All developers must know how to debug their code and since the debugger is easy to use it won’t be a big task to learn.
Features of the Debugger Tool
The various features of the Debugger are:
- Search and filter option: You can search for certain file content or filter functions of the selected files. This option helps you to save time in searching for the required file or function. The search options support regular expression and case insensitive.
- Lists all js files: In the debugger tab you will have a sidebar displaying all the files under their respective URL. You have multi-tab support in the debugger to work on multiple files at the same time.
- Watching expressions: You can monitor JS variable values and expression values when you are stepping through the code. This helps to check for correct values and understand how these values change.
- Breakpoints and control buttons: You can have XHR, event listener, and dom mutation breakpoints and the debugger provides basic control buttons such as Resume/Pause, Step over, Step in, and Step out.
Benefits of the Debugger Tool
The various benefits of the debugger are:
- Understand and debug code: You can use the debugger to understand the code line by line and, if required, find bugs in the code. The debugger is simple to use and allows you to find bugs very easily.
- Inspect expressions and variables: You can check the values of specific variables or expressions by adding them to the underwatch expressions. It helps a lot in checking the changes in the values of the variables as the execution proceeds.
- Format option and color code: The code can be formatted to look clean and readable. The code is also viewable in color, which gives you an idea of various code constructs.
How to locate the Debugger in Firefox?
The Debugger is present in DevTools as a tab in the main toolbar. To open it, follow these steps:
Step 1: Using Firefox, visit the site where you want to use the debugger. Right-click on the site and then click Inspect from the context menu that appears.
Step 2: The DevTools will open, and there will be many tabs, and one of them will be Debugger. Click on it to open Debugger.
Opening Debugger
UI of the Debugger
The Debugger can be divided into three sections: the sources outline search pane, the code viewer, and the breakpoints pane.
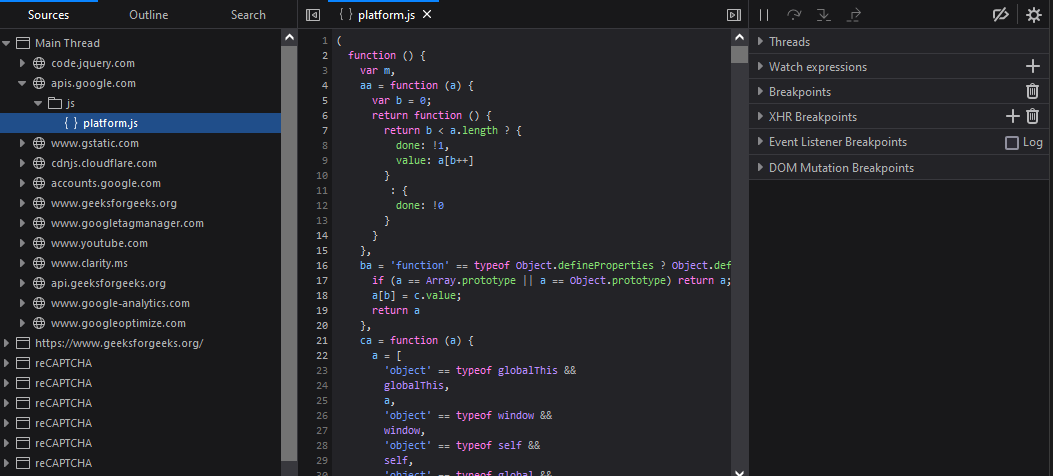
UI of the Debugger
1. Sources Outline Search pane
This pane provides three tabs that are sources, outline and search.
Various tabs in the pane
- Sources Tab: This provides the list of all the js files under expandable trees which starts with the files origin. All these trees are under various thread categories.
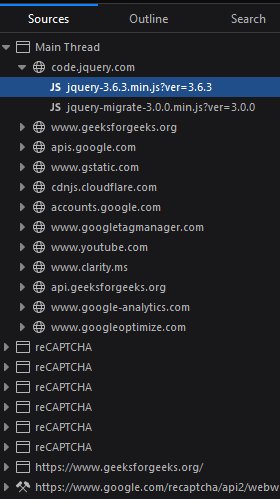
Sources tab
- Outline Tab: The outline tab provides you filter input bar to filter various functions present in the selected file.
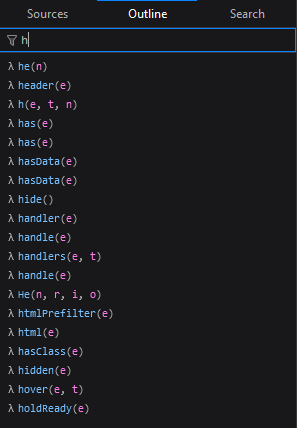
Outline tab
- Search Tab: Provides you a search bar to search for content in all the files of the web page. You also get options to enable regular expression input, match case with the input, and match whole word which means it match text beginning and ending with whitespace.
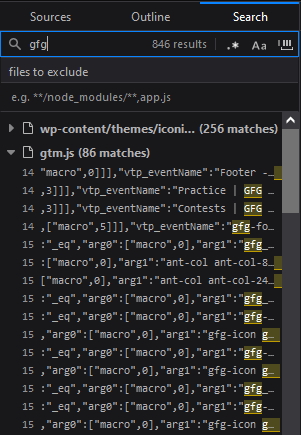
Search Tab
2. Code viewer
This section views the code and provides option to format, ignore source and collapse/expand panes. You can click on line number to add breakpoint. You can right click the breakpoint to get a context menu which you can use to remove the breakpoint or disable it and you also get option to add conditional breakpoint and add log message.
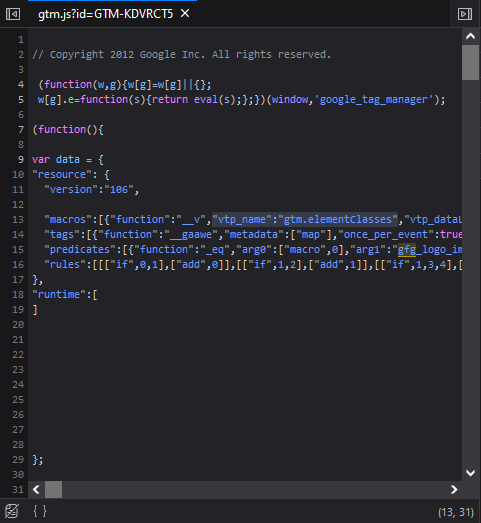
Code Viewer
- Expand/Collapse Sources, Outline, Search pane: The button is present in the top-left corner of the viewer which is used to show or hide the Sources, Outline, Search pane.
- Expand/Collapse Breakpoints pane: The button is present in the top-right corner of the viewer which is used to show or hide the Breakpoints pane.
- Ignore Source: This button is present in the bottom-left corner and is used to ignore of the current file to not be used in the execution.
- Pretty print source: This button appears as “{ }” is present in the bottom-left corner of the viewer which is used to prettify or format a minified file and opens in a new tab.
3. Breakpoints pane
This pane provides control buttons and multiple sub-panes or section of information about the breakpoints.
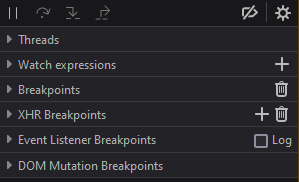
Breakpoints pane
- Buttons
- Resume/Pause: Use it to resume or pause the debugger. You can also use the shortcut key F8.
- Step over: Use it to step to the next line of the executing code. You can also use the shortcut key F10.
- Step in: Use it to step in to a function of the executing code. You can also use the shortcut key F11.
- Step out: Use it to step out of the function of the executing code. You can also use the shortcut key Shift + F11.
- Deactivate breakpoints: You this button to disable all the breakpoints.
- Debugger Settings: This button provides a list of options to check/uncheck. These options are:
- Disable JavaScript: Check this option if you want to test the site without JavaScript.
- Inline Variable Preview: Check this option to display variables with there value at the end of the line when you step through the code.
- Wrap Lines: Check this option to wrap code to the next line in the code viewer.
- Source Maps: Check this option to show source maps in the Sources tab.
- Hide Ignored Sources: Check this option to hide the files in the Sources tab that were ignored.
- Ignore Known Third-party Scripts: Check this option to ignore 3rd party scripts.
- Sub-panes
- Threads: Provides the list of various threads of the web page.
- Watch expressions: You can use the add button to add expression and variable which values can be view under this pane.
- Breakpoints: Provides the list of breakpoints added. You also get checkboxes to pause on exceptions and pause on caught exceptions. You also have a bin option to remove all breakpoints.
- Call stack: Provides a expandable tree of functions that executed to reach the code.
- Scopes: Various values which come under the function, method, or event handler where the break occurred are mention under this pane.
- XHR Breakpoints: You can add URL or keywords which will break when a XHR request is made. If you have added a keyword then you can click the pause on any URL checkbox to break on these URL which contain the keyword.
- Event Listener Breakpoints: You get list of various events listener with checkboxes which can be check to add breakpoints for event handlers. You also have filter input to filter the event type and use the log checkbox to display information about events in the console tab.
- DOM Mutation Breakpoints: In the DOM section in elements tab you can add breakpoints to elements which break when modifications are done in the elements. The breakpoints are Subtree Modification, Attribute Modification and Node Removal which can be set by right clicking the elements and selecting the required breakpoints from break on menu. All the DOM breakpoints are listed under this pane which you can enable or disable by clicking on the checkbox or remove by clicking the cross icon.
Showing usage of the Debugger
Lets visit the GFG site and use the Debugger to inspect and debug.
Step 1: Visit the GFG site and locate the Debugger in the DevTools.
Step 2: Add the required breakpoints and use the controls to control the execution.
Using the Debugger in GFG site
The developers can inspect or debug the JS code in the browser itself using the Debugger provide by Firefox browser. The tool provides various options to make the code easier to view and add breakpoints to control the flow of execution.
Share your thoughts in the comments
Please Login to comment...