Memory Tab in Mozilla Firefox Browser
Last Updated :
10 Oct, 2023
The Memory Tab in Firefox is a tool that helps you analyze the memory consumption of a web page. It takes a snapshot of the site’s memory heap and provides a number of views to analyze the memory consumption of your site. Web developers and performance enthusiasts can use this tab to gain insights into how their web projects utilize memory resources. The Memory tab is a valuable tool for diagnosing and optimizing the memory performance of web applications, helping developers ensure a smoother and more efficient user experience.
Why Memory Tab is Helpful:
- Optimization: Using the memory tab in Firefox we can understand our website memory usage and can make changes accordingly. Thus increasing the performance of our website.
- Memory Usage Visualization: The tool provides various views that can help us to visualize memory usage throughout the site which is helpful to analyze the site faster and effectively.
- Memory Leakage: Sometimes during development, it is hard to look for memory leakage so, the memory tool helps the developer to analyze any possible memory leakage pretty instantly.
- Comparing Memory Usages: The tool also provides functionality to compare the snapshots that you take which is very helpful for changes made on the go to check for memory usage during development.
- Monitoring: It’s a good tool to occasionally monitor the memory usage of the site. As the user base grows the sites must be able to run in various kinds of systems with a wide range of RAM sizes.
How to Open Memory Tab
To open the memory tab follow these steps:
- Step 1: Launch Firefox and go to the site you want to analyze.
- Step 2: Right-click on the page and select “Inspect” or press Ctrl+Shift+I (Windows/Linux) or Cmd+Opt+I (Mac) on your keyboard to open the Developer Tools.
- Step 3: In the Developers Tools, there will be multiple tabs click on the one named “Memory”.
If you do not see the memory tab in the developer tools then follow these steps:
- Step 1: In Developer Tools, in the top-right corner click the three horizontal dots and then click “Settings” from the menu that appears. A setting section will open.
- Step 2: Under “Default Developer Tools” check “Memory”. It will instantly add the “Memory” tab in the developer tools.

Opening Memory Tab
Understanding Various Options in Memory Tab:
It provides various options for capturing memory usages in snapshot which can be stored or compared or visualize by the user. A snapshot is just the memory state at a particular point in time.
1. Taking Snapshot:
A button in the top-left corner is provided in the memory tab to take snapshot. On Clicking it we will see an entry for the new snapshot, including its timestamp, size, and controls to save or clear this snapshot and on the right-hand side the view of the snapshot will be presented. We can have multiple snapshot at a time but on refreshing the page it gets deleted.

Taking Snapshot
2. Deleting Snapshot:
These snapshot which are not required can be removed to make the snapshots list clean for use.
- Delete All Snapshots: A button in the top-left corner is provided in the memory tab to delete all snapshots. On Clicking it we will all snapshot gets deleted.
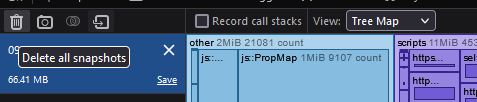
Delete all snapshot button
- Delete Individual Snapshots: We can also delete individual snapshot by using the cross icon in the top-right of the snapshot pane.
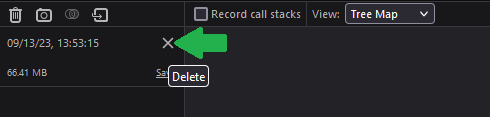
Remove Individual Snapshots
3. Importing Snapshot:
We can share the snapshot among one another but use it in the memory tab we have to import it via the import button.
To import snapshot you must have file with “.fxsnapshot” extension. There will be a button present alongside with “Compare snapshots” button. A browse dialog box will appear where you locate the life to be imported.
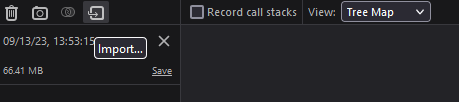
Import Snapshots
4. Saving Snapshot:
We can save the snapshot in our machine or share the snapshot with others to do that we have to first save it somewhere in our local machine to do that we use the save button.
To save the snapshot just press the save button present in the snapshot pane a browse dialog box will appear to save the file in a specific location with “.fxsnapshot” extension which can be imported.
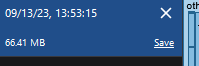
Save Button
5. Comparing Snapshots:
During development we may want to check the memory usage after some changes is made to the site. To do so be can capture some snapshots before the changes are made and after the changes are made and then compare there snapshots. But at one time only two snapshot can be compared.
You can compare two snapshots at a time. To compare two click the button after the take snapshot button. You will then have to check two snapshots you want to compare.
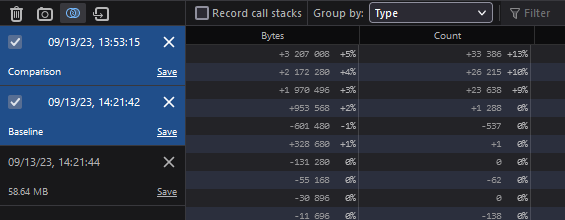
Compare Snapshots
6. Recording call stacks:
To know exactly where in your code you are allocating memory check “Record call stacks”. This option record memory calls before the memory is allocated so after checking this option don’t forget refresh the page and take the snapshots again.
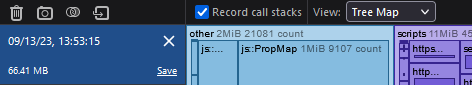
Record call stack
Different Views:
For every snapshot there are three main views provided by the Memory Tool.
- Tree map: This view shows memory usage as a tree map. The various scripts, strings, objects etc. sizes can be viewed using the tree map view.
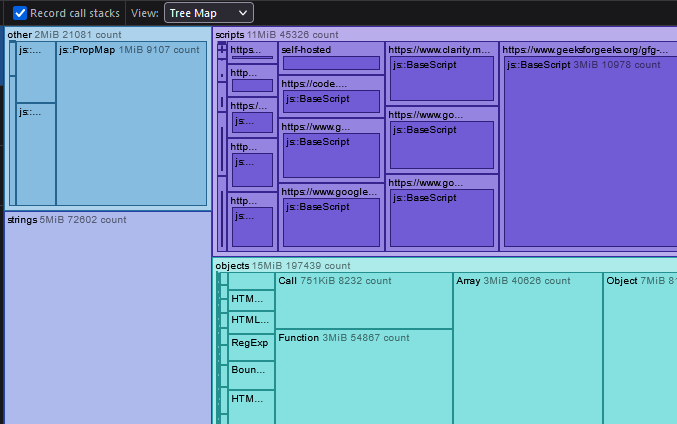
Tree Map View
- Aggregate: This view shows memory usage as a table of allocated types. We can Group by Type, Call Stack and Inverted Call Stack. We also have the option to filter the contents of the snapshot. The table displays the size (in bytes) and count of the programming construct which consumes memory such as objects, strings, functions etc.

Aggregate View
- Dominators: This view shows the “Retained Size” and “Shallow Size” of objects. Retained Size is the size of objects plus the size of other objects that they keep alive through references. Shallow Size is the size of the objects which considering the objects it references. We can Label them by Type and Call Stack.
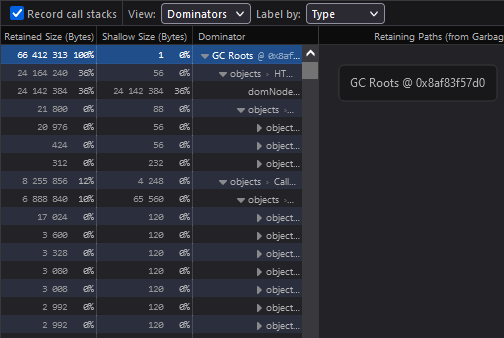
Dominators View
Note: If you’ve checked “Record call stacks” then the Aggregate and Dominators views can show you exactly where in your code allocations are happening.
Share your thoughts in the comments
Please Login to comment...