Devtools in Mozilla Firefox Browser
Last Updated :
06 Oct, 2023
Firefox provides a suite of tools for developers to use on their site. This tool lets developers edit styles, check for performance, check for responsiveness, check for the webpage’s use of storage, and much more. These tools are in-built into the Firefox browser and provide easy access and a simple UI for developers to understand and use. This set of tools is accessed in a sub-window called Developer Tools, or DevTools.
Benefits of DevTools
DevTools is a great place for developers to debug and view various things related to their web pages. The benefits it provides to the developers are:
- Check for Performance: The tools help us to check the site performance with respect to storage, memory or network response speed. You get a good view regarding the memory usage of JS and various external resources used by the site, which prevents any memory leaks. You can check the time it takes for resources to get downloaded and used by the webpage, which allows developers to make judicious decisions on how to improve the site loading time.
- Guide sites and videos: The DevTools in Firefox are well documented, and the team behind the DevTools provides the latest documentation and videos that act as guides to new users. The links are also provided in the top-right three-dot menu.
- Easy to Navigate and Responsive UI: The UI is clean and well organized with a proper layout, and also because the DevTools are built-in to the Firefox browser, these tools feel responsive and have a very short loading time. The user can also change the DevTools theme in the setting option present in the three dots in the top right corner of DevTools.
- Customizable UI: The tabs in the DevTools can be moved to rearrange according to the user’s needs. We can dock the DevTools to the bottom, right, left, or into a separate window. In every tab, there can be multiple sections; the section width can be increased or decreased according to the user’s preference.
- Check for Responsive: The DevTools can be used to check the site for various device widths and heights, which saves developers time as the DevTools can simulate various device resolutions and behaviors.
Opening the DevTools in Firefox
We have multiple ways to open DevTools. These are:
- Using Shortcut Keys: Open Firefox and visit the webpage where you want to use the Developers tool, and then press the shortcut keys “Ctrl+Shift+I” or F12.
- Using the right-click context menu: Open Firefox and visit the webpage, then right-click anywhere on the page and select inspect from the context menu that appears.
Opening DevTools
About all the DevTools in Firefox
There are many tools and features in Firefox DevTools, lets us understand them one by one.

All DevTools options
Core Tools
- Inspector: This tool is used to view the HTML code and various styles used in the webpage. It also provides options to edit or use certain features related to the structure and styles, such as eyedroppers, fonts, animations, box models, etc.
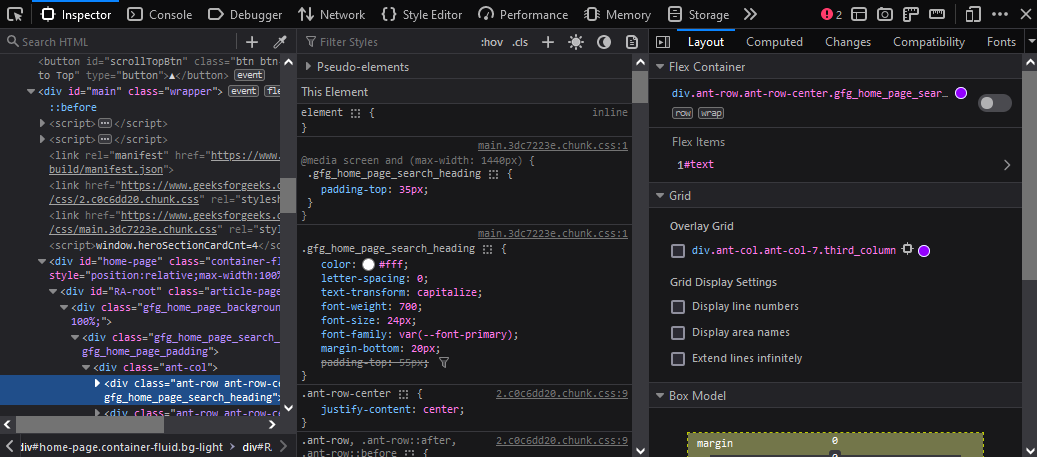
Inspector Tool
- Console: All messages, logs, and errors of a webpage are displayed in the console tab. Developers can also enter their own JS code to perform certain tasks. We can also turn on Custom Formatters in Settings to customize the way objects are displayed.
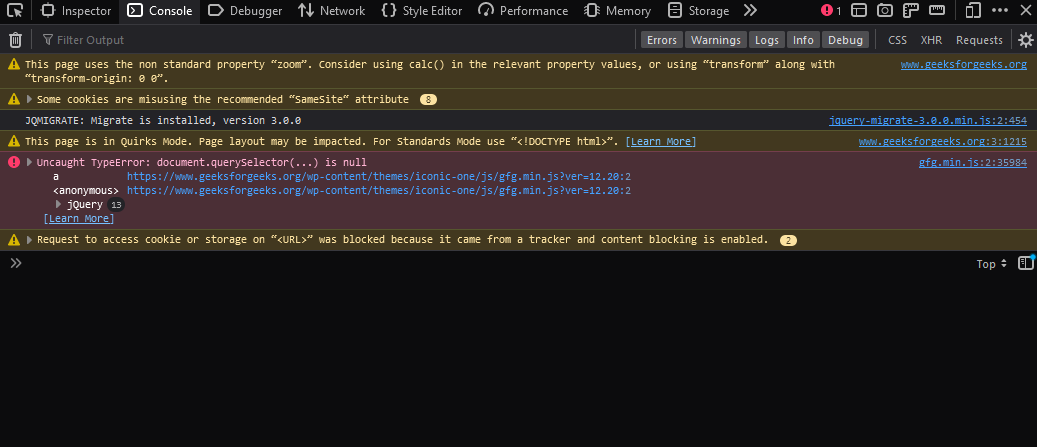
Console Tool
- Debugger: Provide the debugging facilities that a traditional IDE provides. The tools allow you to add a breakpoint to stop the execution at a particular point in the webpage JS code and provide buttons to pause, step over, step in, and step out with respect to the code execution.
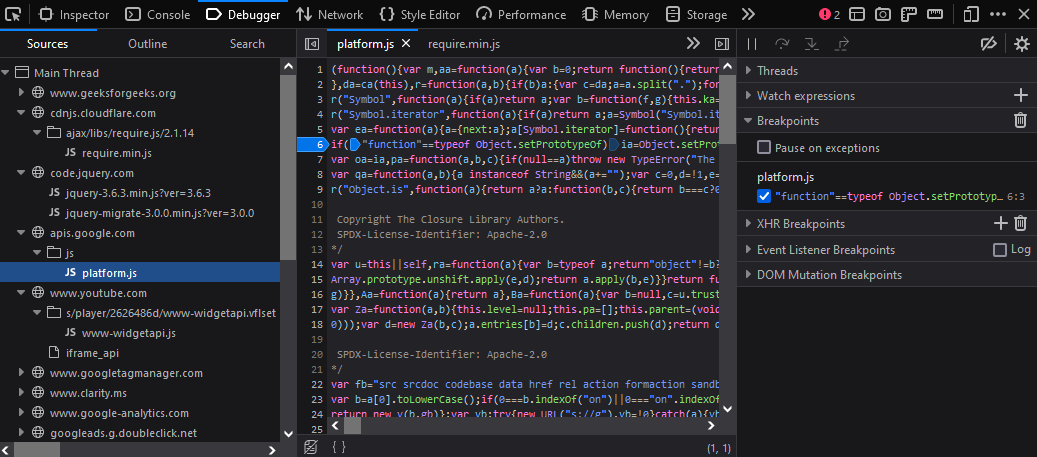
Debugger Tool
- Network: This tool is used to view various network requests made when a page is loaded. The various resources downloaded by the browser, such as HTML, CSS, or JS libraries, can be viewed in this tool.
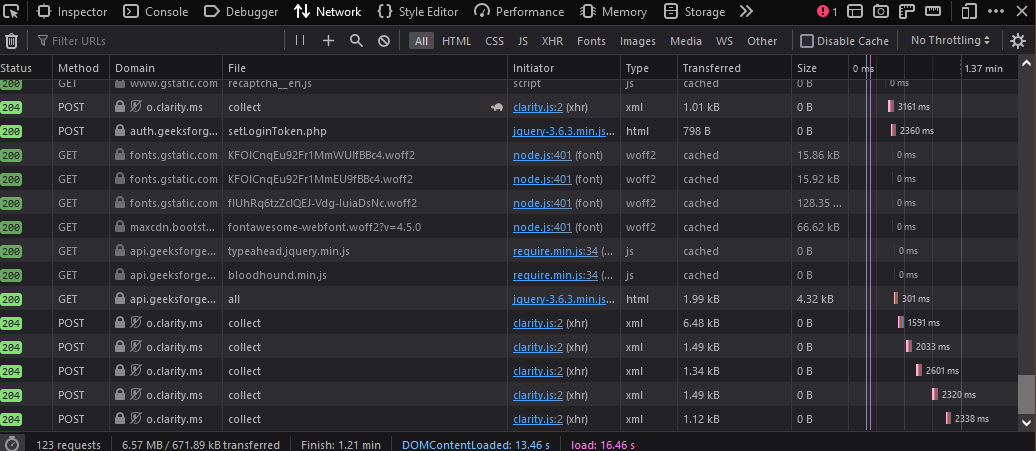
Network Tool
- Style Editor: The tool is used to view and edit all the stylesheets on a webpage, which helps the developers customize the CSS to check it in the browser itself. We can also create new stylesheets or import them and apply them to the page.
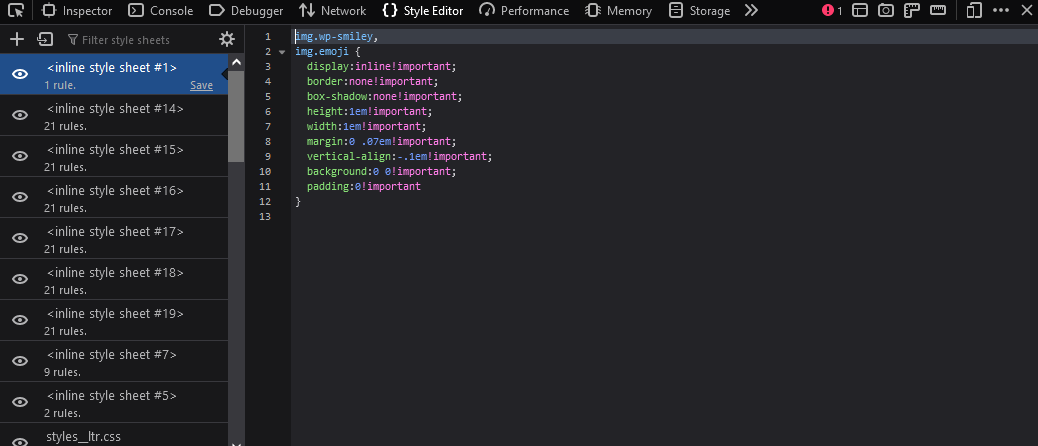
Style Editor Tool
- Performance: The tool is used to check the webpage performance by capturing the site for CPU usage, network requests, events, etc. and providing graphs and tables so that the developers can easily get the performance information.
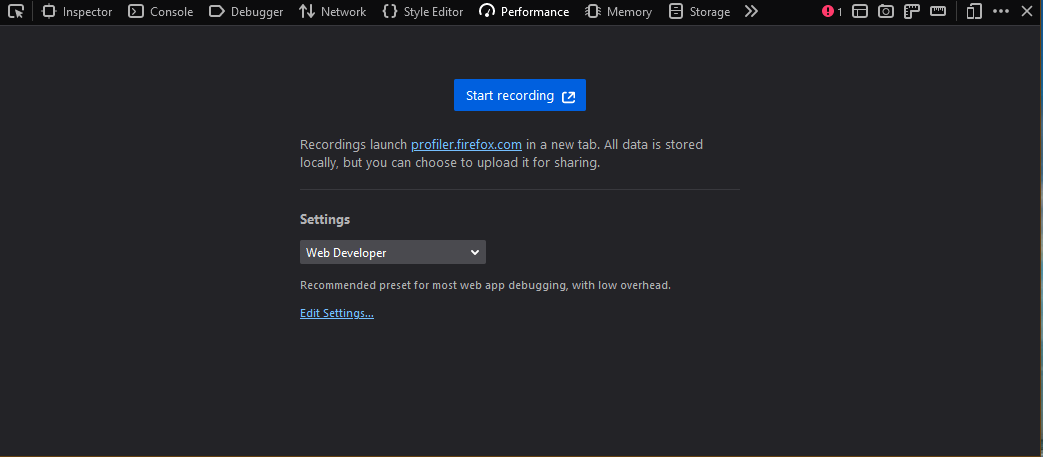
Performance Tool
- Memory: The tool lets you display the heap memory of the current webpage with respect to the JS that is being run. It takes snapshots of the current heap memory and provides the necessary views.
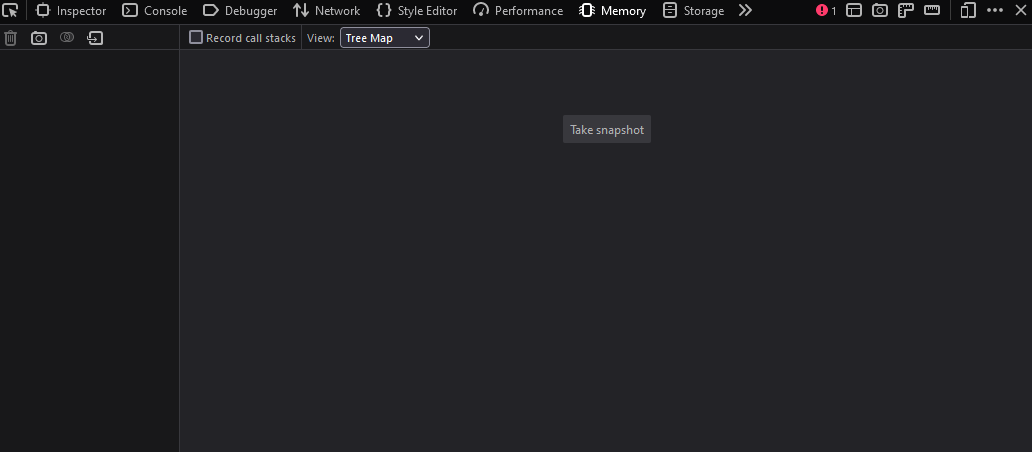
Memory Tool
- Storage: The tool displays all the possible types of storage used by the site, which are cache storage, cookies, indexed databases, local storage, and session storage. Developers can view and get an idea of what storage the browser is using, which helps them debug for any kind of potential issue.
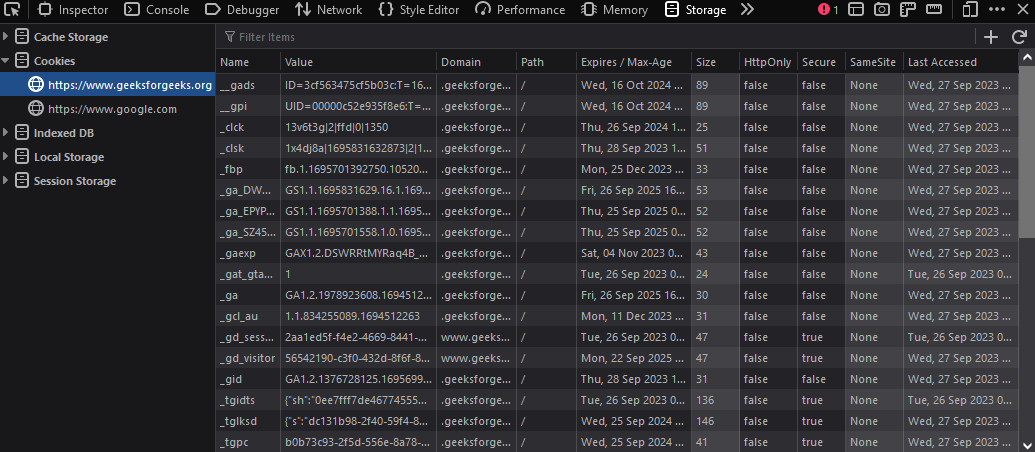
Storage Tool
- Accessibility: The tool provides a tree of all accessibility items, such as buttons, links, and alternative text used in the webpage. It’s also used to mark issues and simulate various color vision deficiencies.
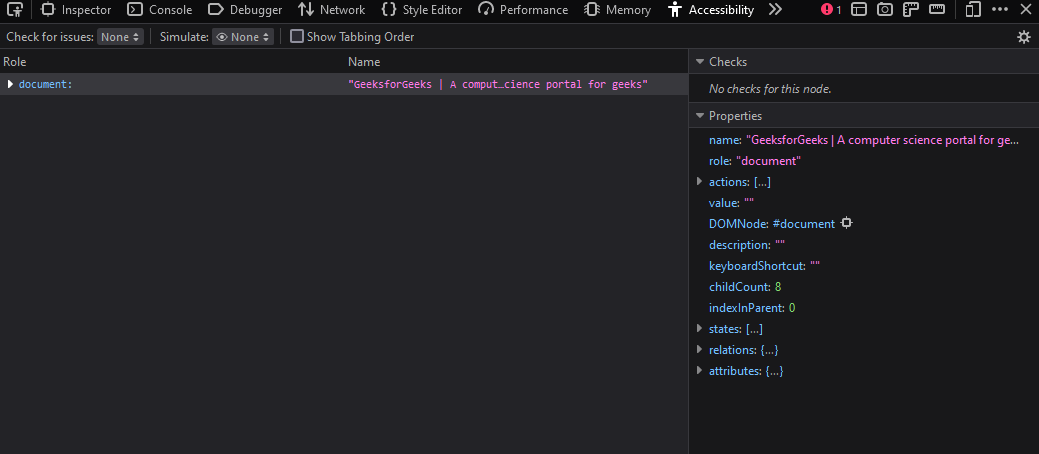
Accessibility
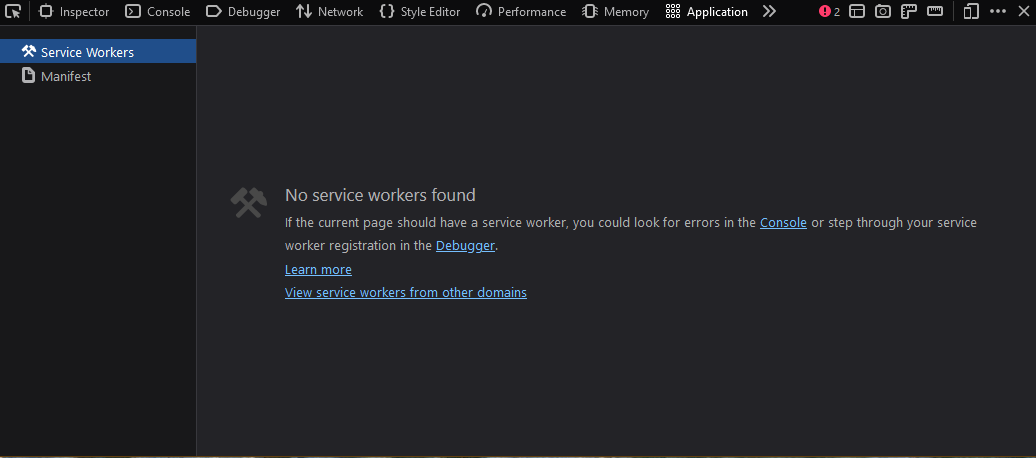
- Application: The tools are basically used for PWA (progressive web apps) for inspecting and debugging service workers and web app manifests, which can improve the webpage to feel more like PWA.
- DOM: The tool provides a tree view to view the DOM of the current page. It provides information about various properties and functions of window object or iframe used in the webpage.
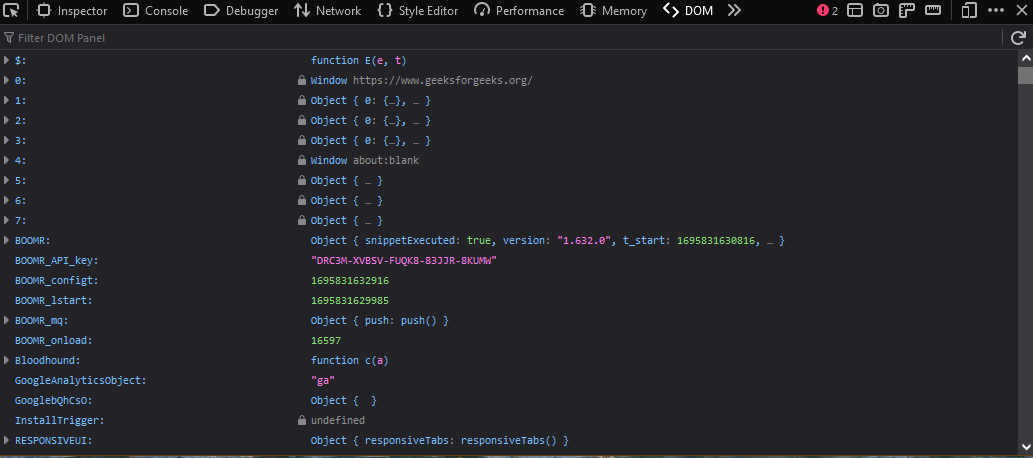
DOM tool
Additional Features
The DevTools is also equipped with some great feature other than the core tools. These are:
- Pick a Element: This option is used to select a specific element in the webpage to be analyzed using the inspector tool. This is a very handy tool which saves time to search a specific element in hundreds of line of html code.
Using Pick a Element Option
- Select an iframe: Provide a drop-down list of various iframe used in the webpage when one of the iframe is selected the DevTools targets that particular iframe document. This allows the developers to focus on a particular iframe and view information or debug that iframe.
Selecting a iframe present in the webpage
- Screenshot: This option captures the screenshot of the whole webpage and save it in the download location. Useful if developers want to view or keed record of the site changes for future use or to share the screenshot with other teams members.
Taking screenshot of the entire webpage
- Rulers: This option adds horizontal and vertical rulers to the webpage. Useful to get accurate length (in pixels) of the webpage or its elements.
Toggling Rulers
- Measure a portion of the page: This option is used to measure the width, height and diagonal length in a rectangular area in the webpage. Useful to get the idea of actual dimension of elements of the webpage.
Measuring a portion of the webpage
- Responsive Design Mode: This option is used to check the webpage in various device width and height to check for responsive. You also have options to rotate the device and turn on touch simulation.
Testing for Responsive Design
- Customizing Developer Tools and Get Help: The three dots provide menu of various options, which is to dock the DevTools in the right, left, bottom or in a separate window. You also get option to show split console which helps by providing access to console tool during working with other tool without continuously accessing to console tab. At the end of the menu you get documentation and community links.
Customizing Developer Tools
Enable missing tools and features
Some of options may be disable by default to enable them first select the top-right three dots and the click Settings from the menu that appears. In the setting menu check what ever option you wan to enable.
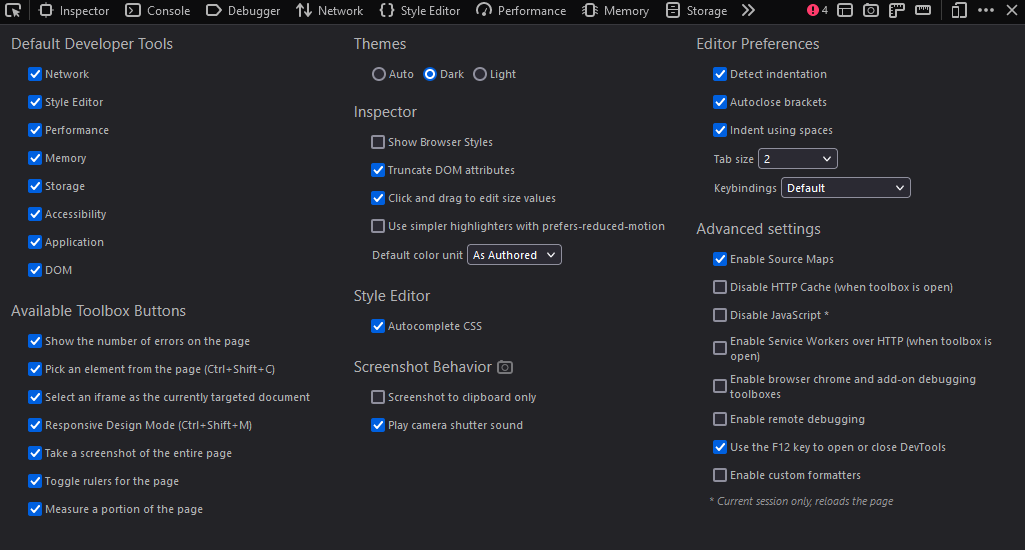
Settings in DevTools
Conclusion
A webpage can have many problems to tackle and debug by the developers. DevTools in Firefox comes as a savior it provides various tools with respect to the webpage styles, JavaScript, performance and many other aspects. These tools have lower learning curve and developers also have options to customize the DevTools window.
Share your thoughts in the comments
Please Login to comment...