Performance Tab in Mozilla Firefox Browser
Last Updated :
27 Sep, 2023
We can analyze the performance of our site by using the Firefox browser performance tool. The tool provides visual information about all the processes that are being run at that time and also various resources, such as JS or CSS, that are being downloaded and rendered. This tool is very helpful for developers who are looking for optimization and good performance for a wide range of users.
Benefits of the Performance Tab:
There are several benefits to using the Performance Tab. Some of them are:
- Resource Management: The tool gives an idea of the various resource usages and sizes on the site. These help you judiciously decide the resources used and performance bottlenecks.
- Sharing Data: You can share the performance usage with other team members or download it for future use. You can also download the captured data in JSON format.
- Visualization: The tab provides various visual charts and graphs to study the performance using a timeline view. You can focus on a particular section in the timeline, which helps you focus on a particular time range.
- Power Usage: It provides information regarding the various power usages of different processes and resources. The power usage helps a lot to design a site that is able to run on a wide range of machines with low computing resources.
- Graphics and Media Information: The various graphics and media files, such as images, logos, CSS animations, videos, etc., can be monitored for their contribution to the site’s memory consumption and loading time in the tab.
How to open the Performance Tab:
The performance tab is a part of the developer’s tools. To open it follow these steps:
Step 1: Open Firefox and visit the site where you want to use the performance tool.
Step 2: Anywhere in the page right-click a context menu will appear. From the menu select “Inspect” it will open the developers. Alternatively you can press “Ctrl+Shift+I” to open the developer tools.
Step 3: In the Developers Tools, there will be multiple tabs click on the one which has “Performance” written in it.

Opening Performance Tab
Using the Performance Tool:
We will be recording the state of the site. Recording here means capturing the performance information and resources usages of the site. To display the captured information Firefox uses a tool called Profiler. A profiler is a process of measuring performance by collecting information about the code.
Capturing the site
To capture the site follow these steps:
Step 1: First locate to Performance tab and then click “Start recording” button to start recording the performance of the page.
Step 2: The button will change to “Capture recording”. This indicates that we can now do some kind of interaction with the page about which we want to check the performance. Once the interaction is performed click “Capture recording” button this will open a new tab with the profiler.

Recording Performance
Changing the preset:
Performance tab loaded with various presets according to the scope of performance measurement. Each preset target specific areas of performance measurement.
Here are the various presets available:
- Web Developer: This preset provides various information about the website that is useful for the web developer. The various CSS animations and JS renderings are displayed using this tool.
- Firefox: The preset is used if you only want to check the Firefox browser’s performance. The primary process used for rendering the size displayed using this preset
- Graphics: The various visuals rendered using CSS and JS are displayed in this preset.
- Media: The various audio, video, images, or any other media are focused on in this preset. We get a good idea about the media download time and size.
- Networking: The performance at various network speeds can be checked using this preset.
- Power: The power usage of various resources used by the site is checked in this preset.
- Custom: We can also set custom presets. After selecting “Custom” in the Settings drop-down, we can select “Edit Settings” to change the necessary information.

Various Presets provided by Firefox
About the UI of Firefox Profiler:
It is a tool provided by Firefox to capture and visualize the performance of the site. The new tab that contains the various visual elements which are graphs, charts, timeline of the sites performance. At first glance the UI can look overwhelming but it is easy to navigate if you divide in into specific parts.
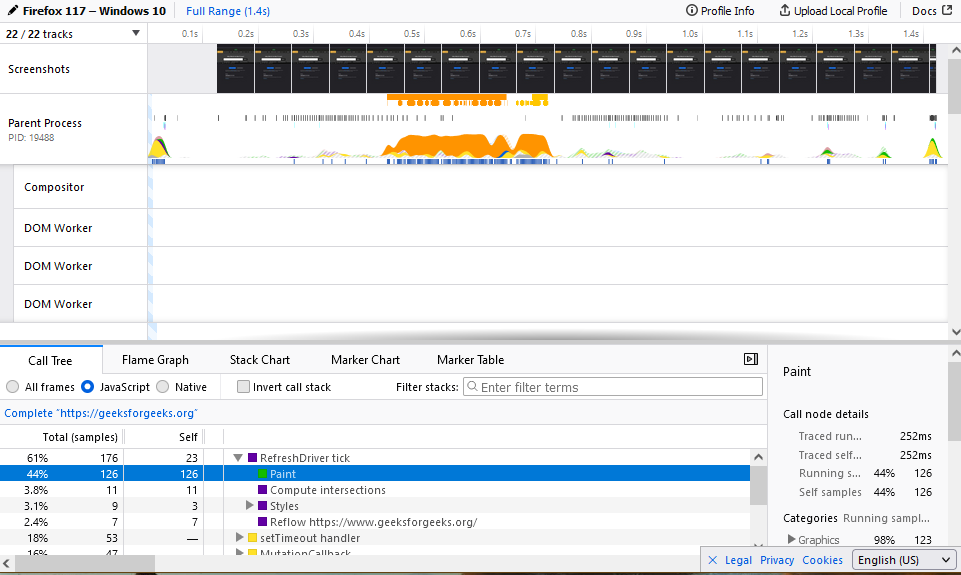
Firefox Profiler
- Tracks: Tracks represent different processes and rendering timelines. You can focus on a specific part of the time line and check the graph spikes to understand the flow of rendering and processing. Some useful tracks are screenshots, renderers, and parent processes. You can hide or unhide a track if you right-click it and select the option you want.
- Call Tree: This view displays the function call stack in JS in a tree-like way. It helps you understand the flow of the execution of functions in JS and the various computer resources used by them.
- Flame Chart: This view provides a representation of function calls. It is an easily readable view and conveys the call stack information clearly because of the hierarchical view.
- Stack Chart: This view is a chronological view of the call stack with respect to the timeline. It displays the different functions called and in what order according to the tacks in the timeline.
- Marker Chart: This view is a timeline view of markers used in the source code during profiling. Some markers are CSS animations, DOM events, and timeout callbacks.
- Marker Table: This presents a detailed tabular view of the marker characters. The information shown is the start time, duration, type, and description, which allow easy searching and viewing of the marker information.
- Network Chart: This chart will only show if there is a network request due to any kind of interaction before pressing “Capture Recording“. It displays the chronological order of network requests during capture.
Timeline in Firefox Profiler:
The timeline is used to visualize all the processes used to run the site, along with its threads. By default, you cannot see the threads in the tracks section, but if you right-click, you can get the list of all threads and check or uncheck which you want to remove from the tracks section.
The timeline section consist of:
- Screenshots: During capture, continuous screenshots are taken, and these screenshots are viewed by the developer to check the site activity and changes. You can hover over the screenshots, which will scale the screenshot for proper viewing. You can also save the screenshot by right-clicking the image and selecting “Save Image As“.
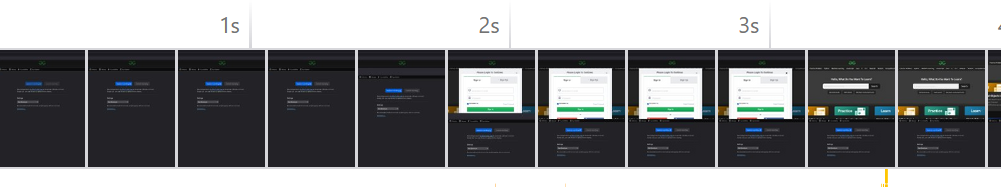
Screenshots in Timeline
- Markers: Markers represent various events and information that occur during capture. Some of the events are mouse input, reflow of the layout, microtasks, etc. You get various information depending on the event you hover over, such as the time to complete the event, the event name, the event description, the event type, and the thread that is running that event.
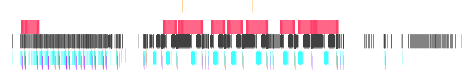
Markers in Timeline
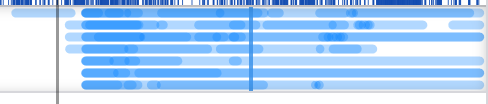
- Activity Graph:The activity graph represents the CPU usage depending on the operations done by the thread. The graphs are color-coded, i.e., for CPU usage, due to JS interpretation, the graph is colored yellow. If you hover over the graph, you get the CPU usage information, the category of the CPU usage, and the call stack of that category.

Activity Graph in Timeline
- Network Usage: The visual line provides information about the network request made by the browser or the webpage. For example, if you clicked a link during the capture, you may have noticed this line in the timeline. On hovering, you get various information, such as the time taken to complete the request, the load value, the URL of the request, and more.
Network Usage in Timeline
- Memory Usage: It’s a graph that represents the memory operations that take place during capture. On hovering, you get information such as the number of operations, the memory usage at that point in the graph, and the highest values that the memory usage reached.

Memory Usage in Timeline
Selecting a Range:
You can also focus on a specific range of time in the timeline section for a better view. To do that, follow these steps:
Step 1: Hover over the timeline, and you will find a horizontal line following the cursor. Drag the horizontal line starting at the point and release it at the end of the desired range.
Step 2: The range will be highlighted, and a zoom button will appear. Click the zoom button to view the selected range.
You can perform the same steps to select a range from the already-selected range. For every range selection, a breadcrumb navigation will be added. You can click these buttons to go back to any of the previous sections or the original captured range labeled as Full Range.

Selecting a Range
Share Performance Profiler Data:
We can upload performance data to Firefox Profiler online storage, which can be shared publicly. You can also download the performance data in JSON format. We also have the option to include additional data for upload and download. Make sure these are untickable if you don’t want to share or download specific information.
The option to upload or download is called “Upload Locale Profile” and is found in the top-right corner of the profiler tab that opened after you clicked the “Capture Recording” button.
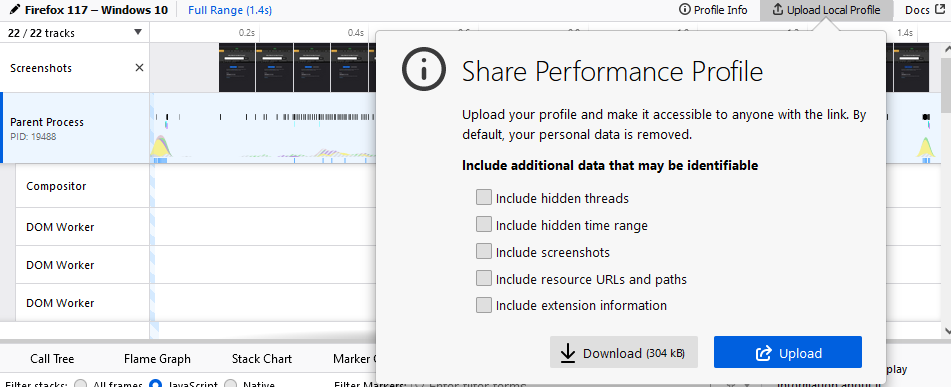
Menu for Sharing Profiler Data
Conclusion:
To make your site popular and user-friendly, you must also look at its performance with respect to various systems and networking configurations. This will not only make your site fast and responsive but also increase the user base using low-end systems. The performance tool provides an excellent visual representation of the performance of the site and the browser, which helps the developers improve their site performance, which is traditionally overlooked.
Share your thoughts in the comments
Please Login to comment...