Console Tool in Mozilla Firefox Browser
Last Updated :
30 Oct, 2023
The console in Firefox displays JS, CSS, XHR, and request issues, which can be used by developers to understand and debug issues on the web page. It is also used to execute JS code and manipulate the web page DOM.
Features of the Console
The various features of the Console are:
- Filter the type of logs: You can filter the logs based on their type, such as errors, warnings, user messages, etc. This helps a lot in focusing only on the problems that matter.
- Color-coded: The errors are displayed in red, and all other logs are displayed in yellow except the user messages. User messages are console logs present in the JS code of the webpage that may be intentionally used to convey a message or print values during development.
- Built-in JS interpreter: You can type JS code, which may or may not be used to manipulate the webpage. You can simply use the console to run JS code, which may not be related to the webpage at all.
Benefits of Consoles
The various benefits of consoles are:
- DOM manipulation: You can manipulate the DOM of the web page or preview various DOM elements and their values. Consoles come with JS support, so plain JS methods and properties can be used for DOM manipulation.
- Listing all possible issues: The console helps you view the different warnings, errors, and issues on the webpage. This helps during development as it clearly explains the problems and provides links to open files in the sources tab.
- Easy distinction: With the color-coded logs and the filter, it’s very easy to differentiate the various logs and focus only on the type you want to work on. If you want to work on error logs, just filter the error logs.
How do I open the console in Firefox?
The Console is present in DevTools. You can directly open it by using the shortcut “Ctrl+Shift+K,” or you can right-click the web page and select Inspect, which will open DevTools, and in DevTools, select the Console pane. If you want to use Console with other tools, just press the Esc button on your keyboard.

Opening Console in Firefox
Various options in the console
The console provides options to filter, clear, or add additional features. Let’s move left to right and understand each option.

Various options in Console
- Clear the Web Console Output: Use this button to clear the console if you want to type JS code in a clear space.
- Filter Output: Use the filter bar to search in the output.
- Filter type of output: Select or uncheck the type of output you require.
- Filter Issues with CSS, XHR, and Requests: Select or uncheck if you want to display their issues.
- Console Settings: In the settings, you can toggle various features that are:
- Persist Logs: If checked, you can reload or navigate around the web page without worrying about clearing the console.
- Show Timestamps: If checked, then time is also displayed on the left-hand side of the outputs.
- Group Similar Messages: If checked, similar types of output will be displayed together.
- Enable Autocompletion: If checked, then when you type JS code, you get suggestions, which you can press Enter or the Tab key to autocomplete.
- Instant Evaluation: If checked, then the possible results of the JS code you type are displayed in the next line.
You also get JS code prompt indicated by “>>”. In that prompt line you get two options present in the right-hand side.

JS prompt
- Evaluation context: Provides a drop-down to select the JS context with respect to various iframes present in the web page.
- Multi-line editor mode: Provides a multi-line JS editor with various options that are run, evaluation context, pretty print expression, previous/next expression, history reverse search, and close.
Showing the Usage of Console
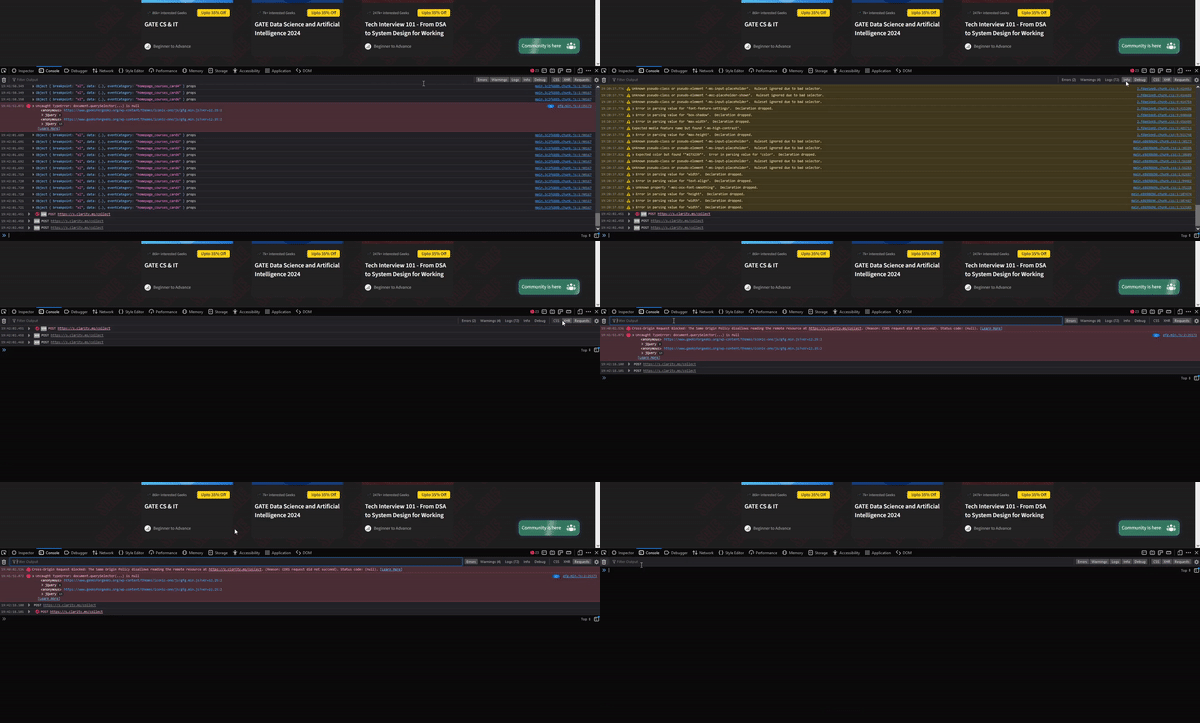
Let’s view various issues on the GFG site.
Step 1: Use Firefox and visit the GFG site, and then press the shortcut key “Ctrl+Shift+K” to open the console.
Step 2: In the console tab, view various logs and issues according to your needs.

Using Console in GFG site
Conclusion
In a site, there may be many errors, warnings, logs, issues, etc. in the JS, CSS, XHR, or request. All of this information and messages are displayed in the console. It comes with JS support that lets you type any JS code that can be used to manipulate the webpage.
Share your thoughts in the comments
Please Login to comment...