Inspector Tool in Mozilla Firefox
Last Updated :
30 Oct, 2023
The Inspector in Firefox is used to inspect and modify the HTML and CSS code of the web page. The inspector provides the DOM section, where you can view the HTML and modify the DOM by editing or deleting the elements. The inspector also displays the CSS code of the selected elements in the Rules pane and also provides other panes such as layout, computed, changes, compatibility, fonts, and animations, which helps a lot of developers deal with various aspects of the CSS code.
The various benefits of the inspector are:
- Modifying DOM: You can directly make changes in the HTML code and get the expected preview on the webpage without any problem. You can delete, edit, and add breakpoints to elements in the DOM.
- Filtering CSS: You can filter properties and values from the list of displayed CSS styles. This helps a lot to save time in searching for and inspecting specific properties used for the element on the web page.
- View Animations: You can also view the animation used on the site and have options to replay and change the speed, which helps inspect the animation more clearly.
- Color-Coded Code: It displays the HTML and CSS code in colors. This helps the developers easily read and distinguish certain keywords from others without looking at the whole code.
- Modify CSS: The CSS can be changed according to your needs. You can add classes, change colors quickly, and even change the values used in the CSS code. You can also inspect the grid or flexbox layout very quickly, which can help a lot in the development process.
- Live Preview: Any proper changes made in the HTML and CSS code are reflected in the webpage with no refresh required. This allows developers to focus more on the changes and save time by not refreshing every time the changes are made.
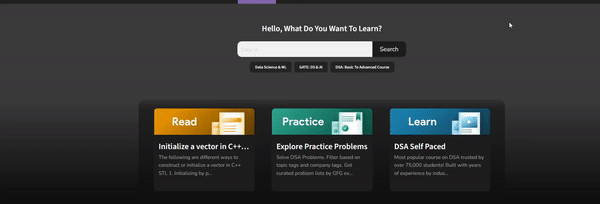
How do I open the Inspector in Firefox?
The Inspector is present in the DevTools as a tab. To open it, follow these steps:
Step 1: Right-click on the web page and click Inspect to open the DevTools, or you can just use the shortcut “Ctrl+Shift+I.”.
Step 2: In the DevTools, the first tab will be Inspector. Click on it.
Opening the Inspector tab in Firefox
How do I use the Inspector?
The Inspector can be divided into two main sections: the DOM section and Pane’s section.
DOM Section
The DOM section displays the rendered HTML code in an expandable tree format, and the code is also color-coded to increase readability. You can edit the DOM directly here, and the changes will be reflected in the webpage instantly. You can add breakpoints, focus on particular elements, or force the state of that element in this section.
DOM section
At the top of the DOM sections, you get various options. Let’s move left to right and understand each option.
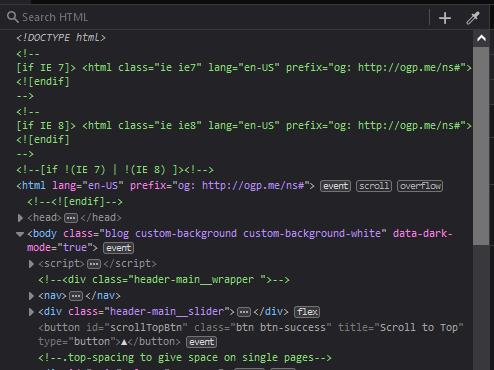
- Search HTML: You can search nodes, attributes, and text in the rendered DOM of the web page. You can use the shortcut “Ctrl+F” to focus on the search bar.
- Create a New Node: Select an element in the DOM section and press this button. You will see a new node being created, which is by default a div. Double-click this node and change the node to whatever you like, and then press enter.
- Grab a color from the page: It works as an eyedropper tool that can be used to select a pixel from the web page, which copies the color hex value to the clipboard.
Various features of the DOM Section
There are many features of the DOM section that can be used to inspect and modify the elements of the webpage.
Picking a particular element: Using the pick an element from the page option present at the end of the top-left part of DevTools, you can select an element to focus it in the DOM section and display its CSS properties in the Styles pane. You can use the shortcut “Ctrl+Shift+C” to select the option.
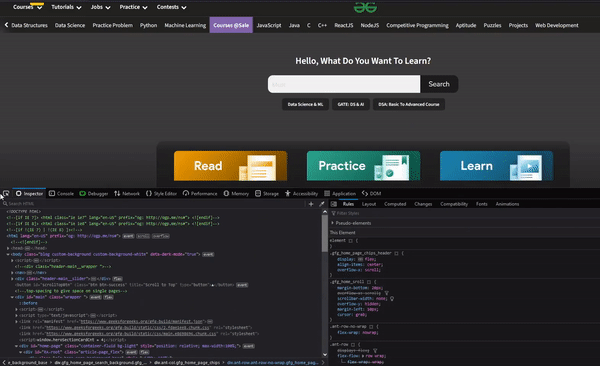
Picking a particular element to inspect
Scrolling to an element to view: You can view an element on the web page by automatically scrolling to it by right-clicking the element and selecting Scroll Into View.
Scrolling to an element to view
Modifying an Element: The various modifications that can be done in the DOM are:
- You can edit text, attributes, tag names, etc. by double-clicking the DOM contents and typing the changes.
- You can also edit the elements in an HTML editor by right-clicking the element and selecting Edit As HTML. To exit the HTML editor, press “Ctrl+Enter”.
- You can drag the tab name of sibling elements to reorder them.
- You can delete an element by right-clicking the element and selecting Delete Element, or by just pressing delete on your keyboard.
- If required, use “Ctrl+Z” to undo your actions in the DOM.
Performing various modification in the DOM
Change the pseudo-class of an element: In the selected element, you can change its pseudo-class, such as hover, focus, visited, etc. Just right-click the element and select the required sub-option from the Change Pseudo-Class option.
Changing Pseudo-class of the element
Adding Breakpoints to an Element: You can block modifications to the element, such as subtree modification, attribute modification, or node removal, by right-clicking the element and selecting the required sub-option under the Break on option.
Adding Breakpoints in Elements
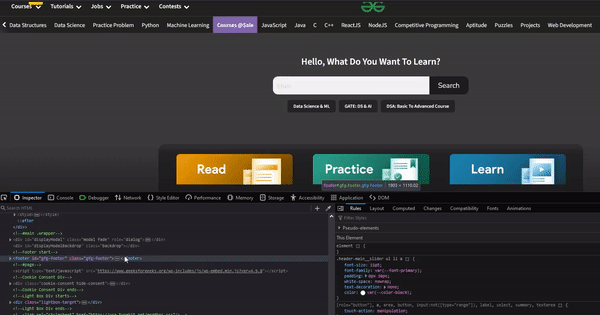
Pane’s Section
The pane’s section comprises various panes that provide CSS code and specific property information. You can have a three-pane inspector where you get the DOM section, the rules pane in the middle section, and the rest of the panes in the third right section. This three-pane inspector can be toggled using the button present in the top-left corner of the pane section.

Pane’s Section
- Rules Pane: The rules pane displays the various properties of the elements along with pseudo-elements and also CSS variables under the respective class names. You also get various options, which are:
- Filter Styles: You can filter the class name, properties, and their values.
- Toggle Pseudo-Classes: This option provides various checkboxes to toggle the pseudo-class of the selected element, such as hover, active, focus, etc.
- Toggle Classes: Use this to add new classes to the styles and check or uncheck each of them individually accordingly.
- Add new rule: Use this to add a new block of CSS code with a class name or element name with respect to the selected element.
- Toggle light color scheme: If the web page has prefers-color-scheme in Media Query, you can set it to light by selecting this option.
- Toggle dark color scheme: If the web page CSS code has prefers-color-scheme in Media Query, you can set it to dark by selecting this option.
- Toggle print media simulation: If the web page CSS code has a print media query, then you can activate it by selecting this option.
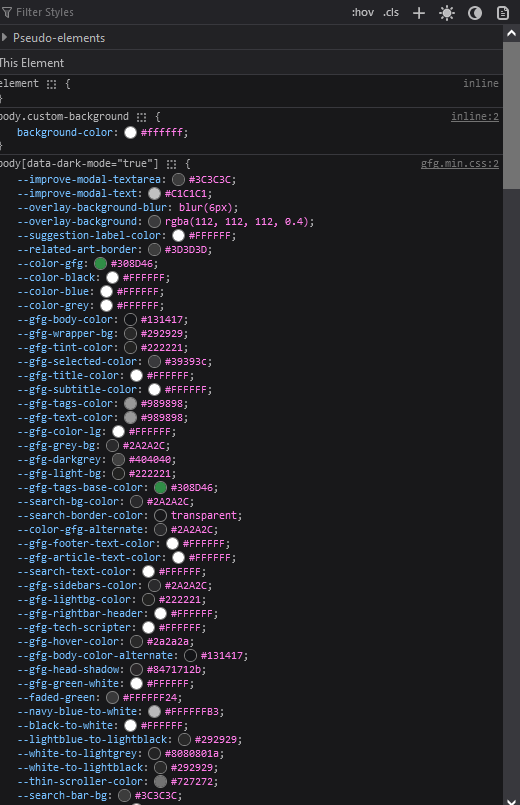
Rules Pane
- Layout Pane: You can view the layout information of the selected element. If it’s Flexbox, you can change the flexbox highlight color, and you also have a button to toggle the flexbox highlight. If it’s a grid, then you can change the grid highlight color, toggle line numbers, area names, and extend lines. You also get the box model with the values of the selected element, which you can modify by double-clicking on them.
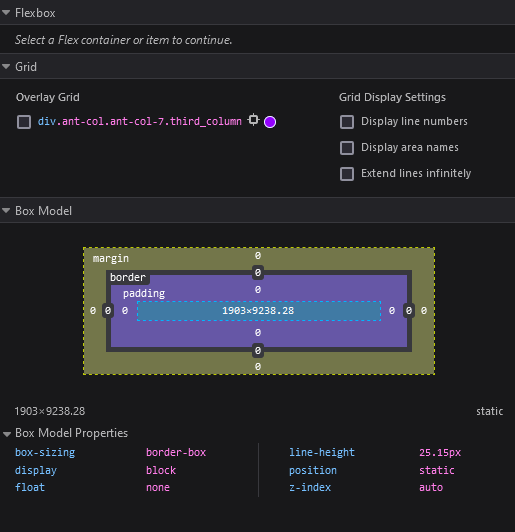
Layout Pane
- Computed Pane: List only the CSS properties of the selected elements. You can also filter the properties on the basis of property type and value. You can view all possible properties supported by the browser by checking the Browser Styles.
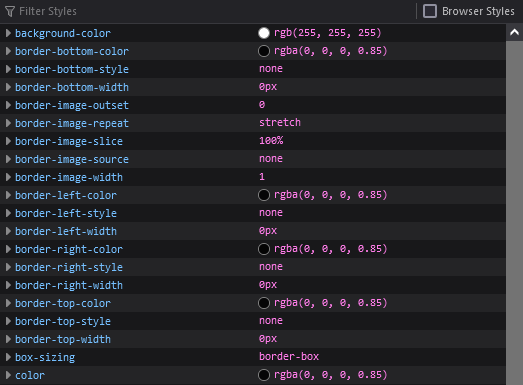
Computed Pane
- Changes Pane: Displays all the changes made to the CSS using the Inspector panes. You also get the option to Copy All Changes to copy the changes to a clipboard, which you can use to modify the source code.
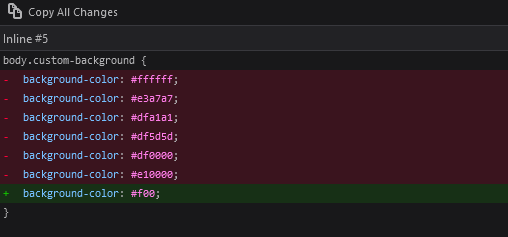
Changes Pane
- Compatibility Pane: Provides the list of properties of selected elements and all possible issues from the whole web page with respect to various top browsers.
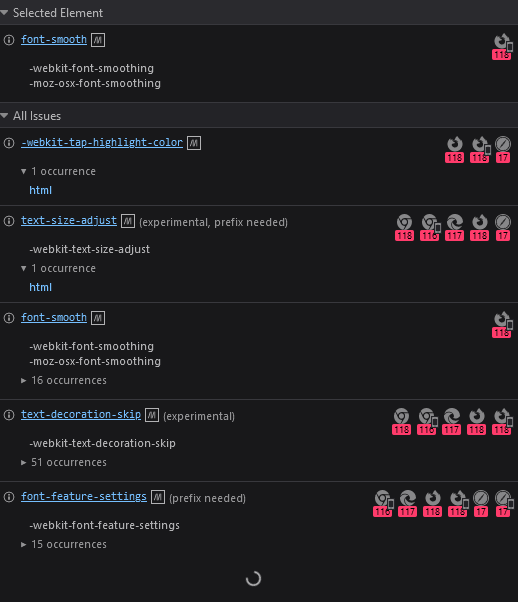
Compatibility Pane
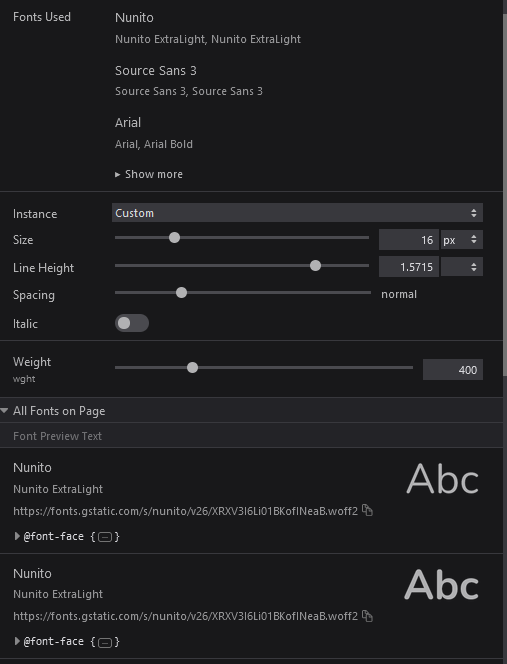
- Font Pane: You can change the size, line height, spacing, italics, and weight of the selected element. You can also see the list of all possible fonts on the web page.
Fonts Pane
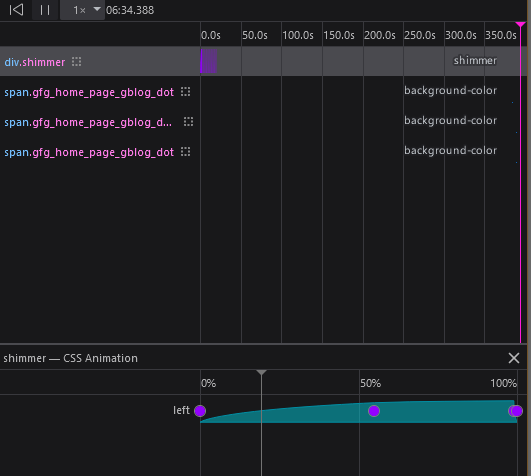
- Animations Pane: This pane displays the animation in the selected element; if there is no animation, then it displays the pick an element button, which can be used to pick the element that has animation. The various options it provides are:
- Rewind the animations. Click this button to reset the animation to its original start.
- Resume or pause the animations according to your requirements.
- Speed: You can slow down or speed up the animations by selecting the times using the drop-down list.
Animations Pane
Showing usage of the Inspector
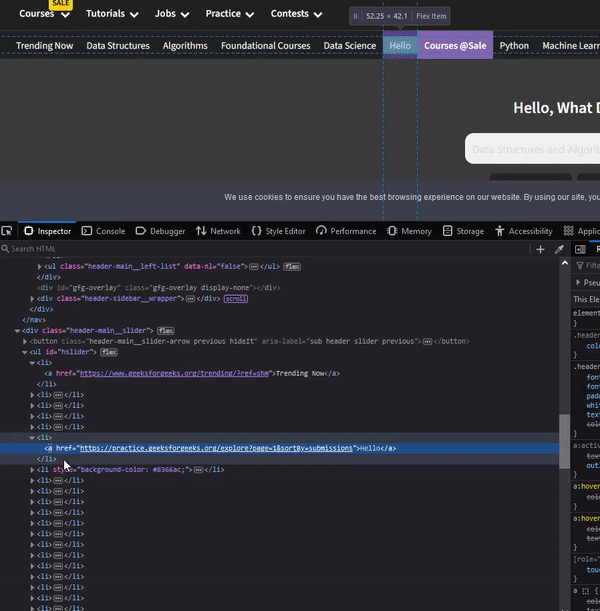
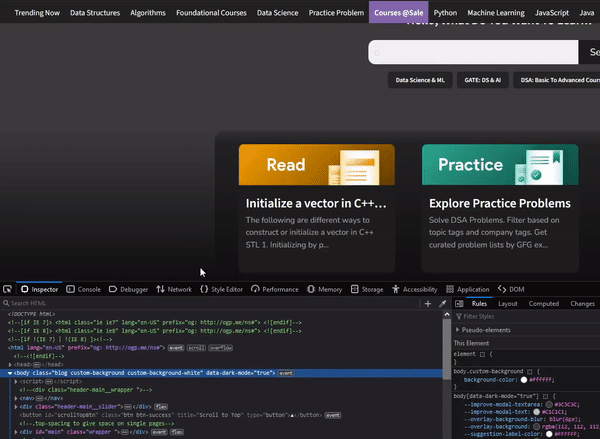
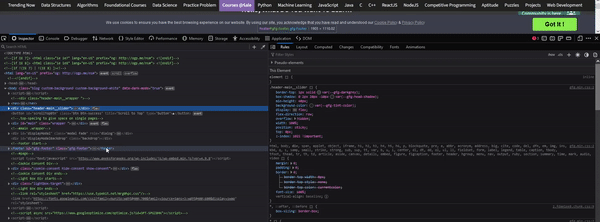
Let’s use the Inspector in the GFG site to inspect and modify the HTML and CSS code of the site.
Step 1: Using Firefox, visit the GFG site and then locate the inspector in the DevTools.
Step 2: Use the Inspector to view HTML and CSS code or modify it and view the live changes in the page.
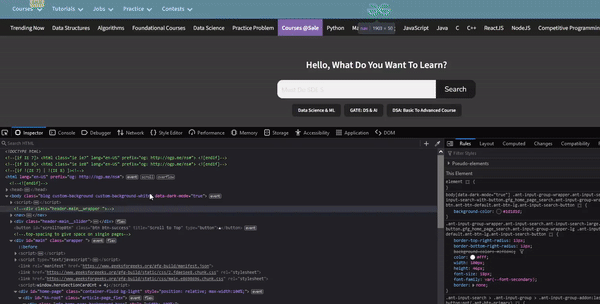
Using the Inspector for GFG site
Conclusion
The developers may need to switch between the browser and the code editor to make changes to the HTML and CSS code, but Firefox provides the Inspector tab, which helps to modify the various aspects of the code and check live changes in the browser itself. By going through the changes tab, all CSS changes can be checked, and modifications to the source code can be done in a single pass, thus saving time.
Share your thoughts in the comments
Please Login to comment...