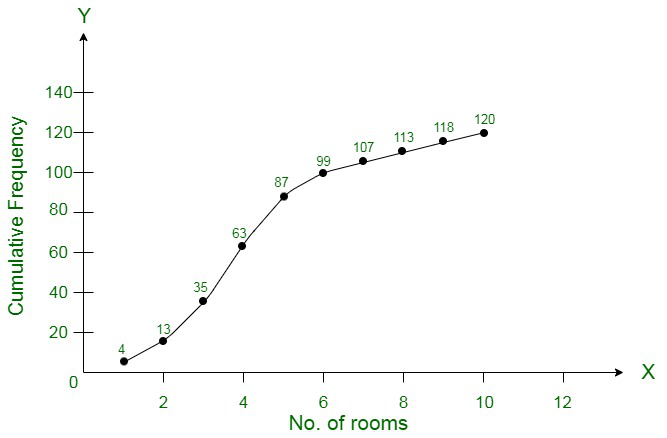
Question 1. Draw an ogive by less than the method for the following data:
| No. of rooms | 1 | 2 | 3 | 4 | 5 | 6 | 7 | 8 | 9 | 10 |
| No. of houses | 4 | 9 | 22 | 28 | 24 | 12 | 8 | 6 | 5 | 2 |
Solution:
| No. of rooms | No. of houses | Cumulative Frequency |
| Less than or equal to 1 | 4 | 4 |
| Less than or equal to 2 | 9 | 13 |
| Less than or equal to 3 | 22 | 35 |
| Less than or equal to 4 | 28 | 63 |
| Less than or equal to 5 | 24 | 87 |
| Less than or equal to 6 | 12 | 99 |
| Less than or equal to 7 | 8 | 107 |
| Less than or equal to 8 | 6 | 113 |
| Less than or equal to 9 | 5 | 118 |
| Less than or equal to 10 | 2 | 120 |
We plot the points (1, 4), (2, 13), (3, 35), (4, 63), (5, 87), (6, 99), (7, 107), (8, 113), (9, 118), (10, 120) respectively by taking the upper-class limit over the x-axis and cumulative frequency over the y-axis of the graph.
Question 2. The marks scored by 750 students in an examination are given in the form of a frequency distribution table:
| Marks | No. of Students |
| 600 – 640 | 16 |
| 640 – 680 | 45 |
| 680 – 720 | 156 |
| 720 – 760 | 284 |
| 760 – 800 | 172 |
| 800 – 840 | 59 |
| 840 – 880 | 18 |
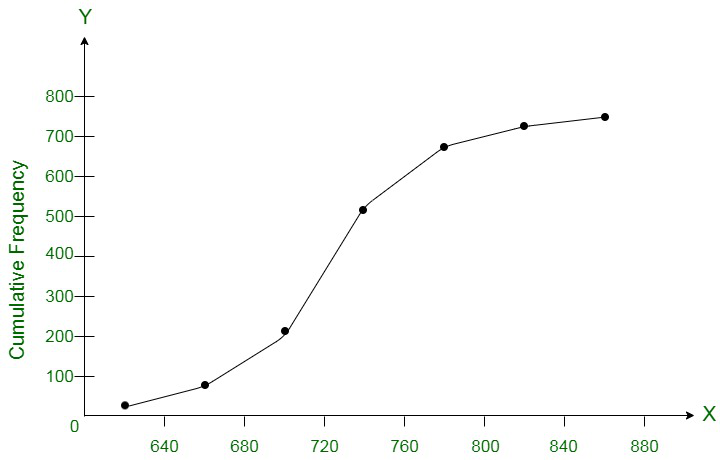
Prepare a cumulative frequency distribution table by less than method and draw an ogive.
Solution:
| Marks | No. of Students | Marks Less than | Cumulative Frequency |
| 600 – 640 | 16 | 640 | 16 |
| 640 – 680 | 45 | 680 | 61 |
| 680 – 720 | 156 | 720 | 217 |
| 720 – 760 | 284 | 760 | 501 |
| 760 – 800 | 172 | 800 | 673 |
| 800 – 840 | 59 | 840 | 732 |
| 840 – 880 | 18 | 880 | 750 |
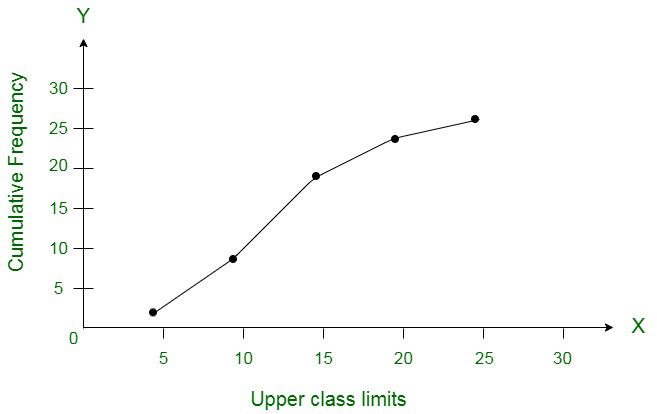
Question 3. Draw an Ogive to represent the following frequency distribution:
| Class-interval | 0 – 4 | 5 – 9 | 10 – 14 | 15 – 19 | 20 – 24 |
| No. of students | 2 | 6 | 10 | 5 | 3 |
Solution:
Converting the given frequency distribution into continuous frequency distribution:
| Class-interval | No. of Students | Less than | Cumulative frequency |
| 0.5 – 4.5 | 2 | 4.5 | 2 |
| 4.5 – 9.5 | 6 | 9.5 | 8 |
| 9.5 – 14.5 | 10 | 14.5 | 18 |
| 14.5 – 19.5 | 5 | 19.5 | 23 |
| 19.5 – 24.5 | 3 | 24.5 | 26 |
We plot the specified points (4.5, 2), (9.5, 8), (14.5, 18), (19.5, 23), (24.5, 26) on a graph by taking the upper class limit over the x-axis and cumulative frequency over the y-axis respectively.
Question 4. The monthly profits (in Rs) of 100 shops are distributed as follows:
| Profit per shop | No of shops: |
| 0 – 50 | 12 |
| 50 – 100 | 18 |
| 100 – 150 | 27 |
| 150 – 200 | 20 |
| 200 – 250 | 17 |
| 250 – 300 | 6 |
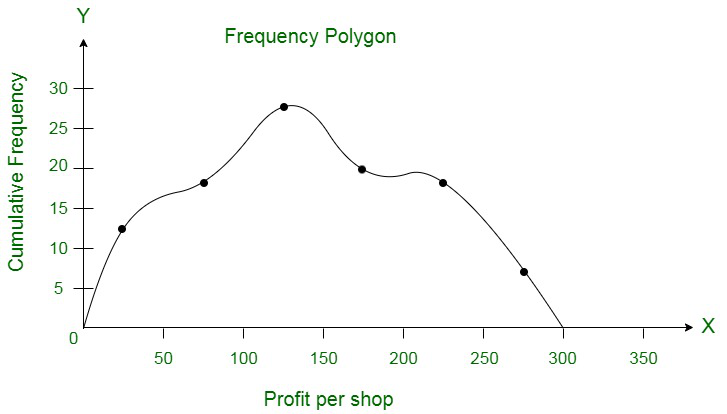
Draw the frequency polygon for it.
Solution:
Now, computing the following data, we have,
| Profit per shop | Mid-value | No of shops: |
| Less than 0 | 0 | 0 |
| Less than 0 – 50 | 25 | 12 |
| Less than 50 – 100 | 75 | 18 |
| Less than 100 – 150 | 125 | 27 |
| Less than 150 – 200 | 175 | 20 |
| Less than 200 – 250 | 225 | 17 |
| Less than 250 – 300 | 275 | 6 |
| Above 300 | 300 | 0 |
Now, the frequency polygon can be computed as follows :
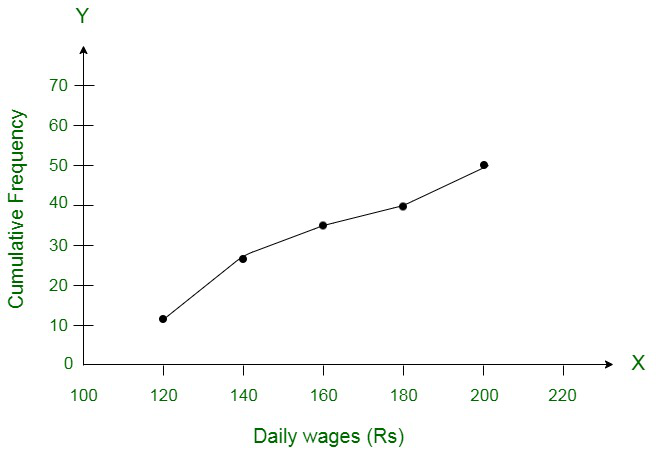
Question 5. The following distribution gives the daily income of 50 workers of a factory:
| Daily income (in Rs): | No of workers: |
| 100 – 120 | 12 |
| 120 – 140 | 14 |
| 140 – 160 | 8 |
| 160 – 180 | 6 |
| 180 – 200 | 10 |
Convert the above distribution to a ‘less than’ type cumulative frequency distribution and draw its ogive.
Solution:
Using the less than method, the following distribution can be converted to a continuous distribution, as,
| Daily income | Cumulative frequency |
| Less than 120 | 12 |
| Less than 140 | 26 |
| Less than 160 | 34 |
| Less than 180 | 40 |
| Less than 200 | 50 |
Mark the point (120, 12), (140, 26), (160, 34), (180, 40), (200, 50), taking upper class limit on the x-axis and cumulative frequencies on y-axis respectively.
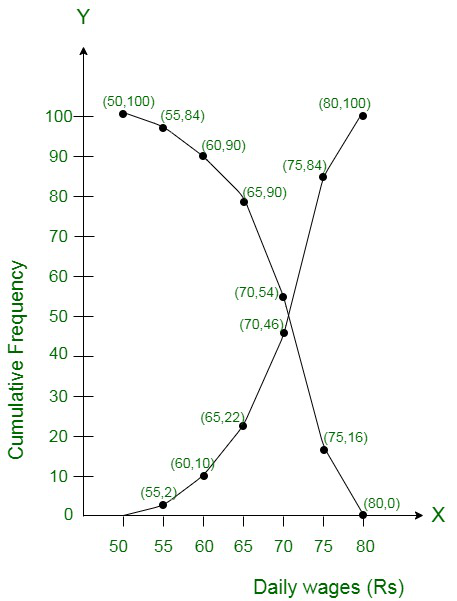
Question 6. The following table gives production yield per hectare of wheat of 100 farms of a village:
| Production yield | 50-55 | 55-60 | 60-65 | 65-70 | 70-75 | 75-80 in kg per hectare |
| Number of farms | 2 | 8 | 12 | 24 | 38 | 16 |
Draw ‘less than’ ogive and ‘more than’ ogive.
Solution:
(i) Computing the Less than ogive
|
Production yield
in kg 1 hectare
| Class |
No. of farms.
(f)
| c.f. |
| Less than 55 | 50-55 | 2 | 2 |
| Less than 60 | 55-60 | 8 | 10 |
| Less than 65 | 60-65 | 12 | 22 |
| Less than 70 | 65-70 | 24 | 46 |
| Less than 75 | 70-75 | 38 | 84 |
| Less than 80 | 75-80 | 16 | 100 |
We plot the specified points (55, 2), (60, 10), (65, 22), (70, 46), (75, 84) and (80, 100) and connect them to form an ogive.
(ii) More than
| Production yield | c.f. | Class |
| More than or equal to 50 | 100 | 50-55 |
| More than or equal to 55 | 84 | 55-60 |
| More than or equal to 60 | 46 | 60-65 |
| More than or equal to 65 | 22 | 65-70 |
| More than or equal to 70 | 10 | 70-75 |
| More than or equal to 75 | 2 | 75-80 |
| More than or equal to 80 | 0 | 80-85 |
We plot the specified points (50, 100), (55, 84), (60, 46), (65, 22), (70, 10), (75, 2) and (80, 0) and connect to form a more than ogive as shown below:
Question 7. During the medical check-up of 35 students of a class, their weights were recorded as follows :
Weight (in Kg)
| Number of students
|
Less than 38
| 0
|
Less than 40
| 3
|
Less than 42
| 5
|
Less than 44
| 9
|
Less than 46
| 14
|
Less than 48
| 28
|
Less than 50
| 32
|
Less than 52
| 35
|
Draw a less than type ogive for the given data. Hence, obtain the median weight from the graph and verify the result by using the formula. (C.B.S.E. 2009)
Solution:
Weight (in Kg)
| Number of students
| Class | c.f. |
Less than 38
| 0
| 36-38 | 0 |
Less than 40
| 3
| 38-40 | 3 |
Less than 42
| 5
| 40-42 | 2 |
Less than 44
| 9
| 42-44 | 4 |
Less than 46
| 14
| 44-46 | 5 |
Less than 48
| 28
| 46-48 | 14 |
Less than 50
| 32
| 48-50 | 4 |
Less than 52
| 35
| 50-52 | 3 |
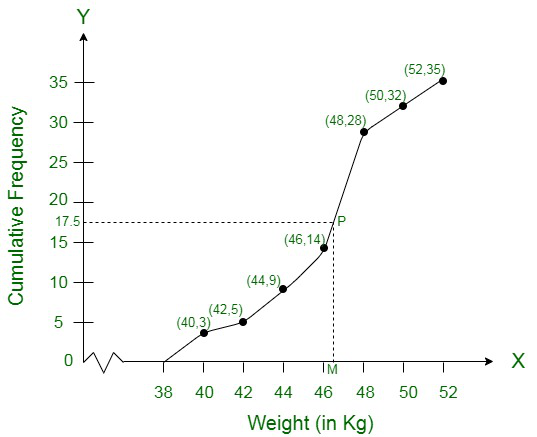
Plot the points (38, 0), (40, 3), (42, 5), (44, 9), (46, 14), (48, 28), (50, 32), (52, 35) on the graph and join them in free hand to get an ogive as shown.
Here N = 35 which is odd
∴  = 252 = 17.5
From 17.5 on y-axis draw a line parallel to x-axis meeting the curve at P. From P, draw PM ⊥ x-axis
∴ Median which is 46.5 (approx)
Now N = 17.5 lies in the class 46 – 48 (as 14 < 17.5 < 28)
∴ 46-48 is the median class
Here l= 46, h = 2,f= 14, F= 14
∴ Median = 
Question 8. The annual rainfall record of a city for 66 days is given in the following tab
Rainfall (in cm):
| 0-10
| 10-20
| 20-30
| 30-40
| 40-50
| 50-60
|
Number of days:
| 22
| 10
| 8
| 15
| 5
| 6
|
Calculate the median rainfall using ogives of more than type and less than type. [NCERT Example]
Solution:
We observe that, the annual rainfall record of a city less than 0 is 0. Similarly, less than 10 include the annual rainfall record of a city from 0 as well as the annual rainfall record of a city from 0-10. So,
the total annual rainfall record of a city for less than 10 cm is 0 + 22 = 22 days. Continuing in this manner, we will get remaining less than 20, 30, 40, 50 and 60.Also, we observe that annual rainfall
record of a city for 66 days is more than or equal to 0 cm. Since, 22 days lies in the interval 0-10. So, annual rainfall record for 66 – 22 = 44 days is more than or equal to 10 cm. Continuing in this
manner we will get remaining more than or equal to 20, 30 , 40, 50, and 60.
Now, we construct a table for less than and more than type.
(i) Less than type
| (ii) More than type
|
Rainfall (in cm)
| Number of days
| Rainfall (in cm)
| Number of days
|
Less than 0
| 0
| More than or equal to 0
| 66
|
Less than 10
| 0+22=22
| More than or equal to 10
| 66-22=44
|
Less than 20
| 22+10=32
| More than or equal to 20
| 44-10=34
|
Less than 30
| 32+8=40
| More than or equal to 30
| 34-8=26
|
Less than 40
| 40+15=55
| More than or equal to 40
| 26-15=11
|
Less than 50
| 55+5=60
| More than or equal to 50
| 11-5=6
|
Less than 60
| 60+6=66
| More than or equal to 60
| 6-6=0
|
To draw less than type ogive we plot the points (0,0), (10,22), (20,32), (30, 40), (40, 55), (50, 60), (60, 66) on the paper and join them by free hand.
To draw the more than type ogive we plot the points (0, 66), (10, 44), (20, 34), (30, 26), (40, 11), (50, 6) and (60, 0) on the graph paper and join them by free hand.
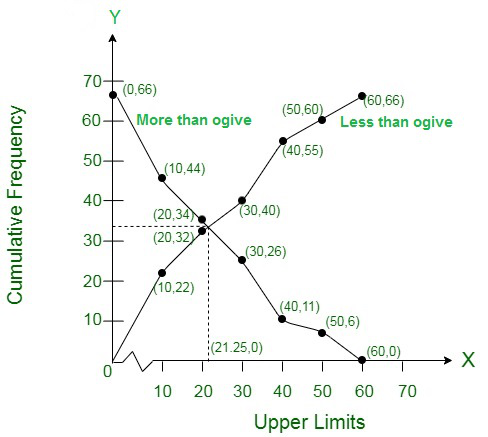
∵ Total number of days (n) = 66
Now,  = 33
= 33
Firstly, we plot a line parallel to X-axis at intersection point of both ogives, which further intersect at (0, 33) on Y- axis. Now, we draw a line perpendicular to X-axis at intersection point of both ogives,
which further intersect at (21.25, 0) on X-axis. Which is the required median using ogives.
Hence, median rainfall = 21.25 cm.
Question 9. The following table gives the height of trees:
Height
| Number of trees
|
Less than 7
| 26
|
Less than 14
| 57
|
Less than 21
| 92
|
Less than 28
| 134
|
Less than 35
| 216
|
Less than 42
| 287
|
Less than 49
| 341
|
Less than 56
| 360
|
Draw ‘less than’ ogive and ‘more than’ ogive.
Solution:
(i) First we prepare less than frequency table as given below:
Height
| Class interval
| Frequency
| c.f.
|
Less than 7
| 0-7
| 26
| 26
|
Less than 14
| 7-14
| 31
| 57
|
Less than 21
| 14-21
| 35
| 92
|
Less than 28
| 21-28
| 42
| 134
|
Less than 35
| 28-35
| 82
| 216
|
Less than 42
| 35-42
| 71
| 287
|
Less than 49
| 42-49
| 54
| 341
|
Less than 56
| 49-56
| 19
| 360
|
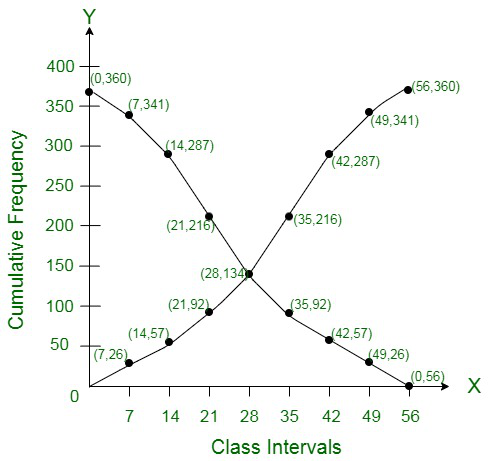
Now we plot the points (7, 26), (14, 57), (21, 92), (28, 134), (35, 216), (42, 287), (49, 341), (56, 360) on the graph and join then in a frequency curve which is ‘less than ogive’
(ii) More than ogive:
First we prepare ‘more than’ frequency table as shown given below:
More than
| Class interval
| c.f.
| Frequency
|
More than 0
| 0-7
| 360
| 19
|
More than 7
| 7-14
| 341
| 54
|
More than 14
| 14-21
| 287
| 71
|
More than 21
| 21-28
| 216
| 82
|
More than 28
| 28-35
| 134
| 42
|
More than 35
| 35-42
| 92
| 35
|
More than 42
| 42-49
| 57
| 31
|
More than 49
| 49-56
| 26
| 26
|
More than 56
| 56-
| 0
| 0
|
Now we plot the points (0, 360), (7, 341), (14, 287), (21, 216), (28, 134), (35, 92), (42, 57), (49, 26), (56, 0) on the graph and join them in free hand curve to get more than ogive.
Question 10. The annual profits earned by 30 shops of a shopping complex in a locality give rise to the following distribution:
Profit (in lakhs ₹)
| Class intervals
| Number of shops (c.f.)
| Frequency
|
More than or equal to 5
| 5-10
| 30
| 2
|
More than or equal to 10
| 10-15
| 28
| 12
|
More than or equal to 15
| 15-20
| 16
| 2
|
More than or equal to 20
| 20-25
| 14
| 4
|
More than or equal to 25
| 25-30
| 10
| 3
|
More than or equal to 30
| 30-35
| 7
| 4
|
More than or equal to 35
| 35-40
| 3
| 0
|
Draw both ogives for the above data and hence obtain the median.
Solution:
Class interval
| Frequency
| c.f.
|
5-10
| 3
| 3
|
10-15
| 4
| 7
|
15-20
| 3
| 10
|
20-25
| 4
| 14
|
25-30
| 2
| 16
|
30-35
| 12
| 28
|
35-40
| 2
| 30
|
Now plot the points (5, 30), (10, 28), (15, 16), (20, 14), (25, 10), (30, 7) and (35, 3) on the graph and join them to get a more than curve.
Less than curve:
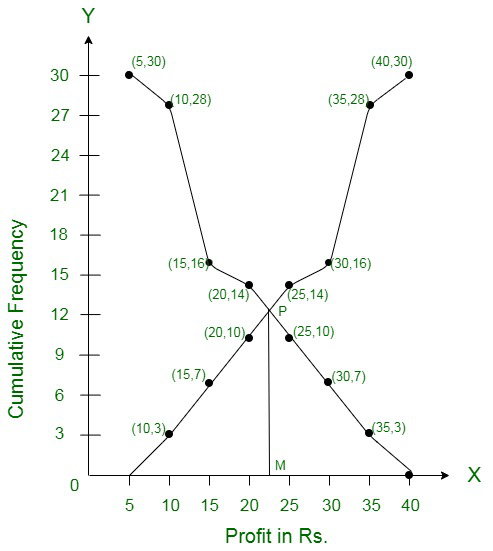
Now plot the points (10, 3), (15, 7), (20, 10), (25, 14), (30, 16), (35, 28) and (40, 30) on the graph and join them to get a less them ogive. The two curved intersect at P. From P, draw PM 1 x-axis, M is the
median which is 22.5
∴ Median = Rs. 22.5 lakh
Share your thoughts in the comments
Please Login to comment...