Class 10 RD Sharma Solutions – Chapter 7 Statistics – Exercise 7.5 | Set 1
Last Updated :
17 Dec, 2021
Question 1. Find the mode of the following data:
(i) 3, 5, 7, 4, 5, 3, 5, 6, 8, 9, 5, 3, 5, 3, 6, 9, 7, 4
(ii) 3, 3, 7, 4, 5, 3, 5, 6, 8, 9, 5, 3, 5, 3, 6, 9, 7, 4
(iii) 15, 8, 26, 25, 24, 15, 18, 20, 24, 15, 19, 15
Solution:
(i)
| Value (x) | 3 | 4 | 5 | 6 | 7 | 8 | 9 |
| Frequency (f) | 4 | 2 | 5 | 2 | 2 | 1 | 2 |
Therefore, mode = 5 because 5 occurs the maximum number of times.
(ii)
| Value (x) | 3 | 4 | 5 | 6 | 7 | 8 | 9 |
| Frequency (f) | 5 | 2 | 4 | 2 | 2 | 1 | 2 |
Therefore, mode = 3 because 3 occurs the maximum number of times.
(iii)
| Value (x) | 8 | 15 | 18 | 19 | 20 | 24 | 25 |
| Frequency (f) | 1 | 4 | 1 | 1 | 1 | 2 | 1 |
Therefore, mode = 15 because 15 occurs the maximum number of times.
Question 2. The shirt size worn by a group of 200 persons, who bought the shirt from a store, are as follows:
| Shirt size: | 37 | 38 | 39 | 40 | 41 | 42 | 43 | 44 |
| Number of persons: | 15 | 25 | 39 | 41 | 36 | 17 | 15 | 12 |
Find the model shirt size worn by the group.
Solution:
From the data present in the table we conclude that
Model shirt size = 40
Because shirt size 40 occurred for the maximum number of times.
Question 3. Find the mode of the following distribution.
(i)
| Class interval: | 0 – 10 | 10 – 20 | 20 – 30 | 30 – 40 | 40 – 50 | 50 – 60 | 60 – 70 | 70 – 80 |
| Frequency: | 5 | 8 | 7 | 12 | 28 | 20 | 10 | 10 |
Solution:
From the given table we conclude that
The maximum frequency = 28
So, the model class = 40 – 50
and,
l = 40, h = 50 40 = 10, f = 28, f1 = 12, f2 = 20
Using the formula of mode
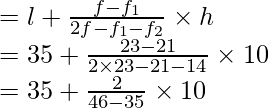
Mode = 
= 40 + 160/ 24
= 40 + 6.67
= 46.67
Hence, the mode = 46.67
(ii)
| Class interval | 10 – 15 | 15 – 20 | 20 – 25 | 25 – 30 | 30 – 35 | 35 – 40 |
| Frequency | 30 | 45 | 75 | 35 | 25 | 15 |
Solution:
From the given table we conclude that
The maximum frequency = 75
So, the modal class = 20 – 25
And,
l = 20, h = 25 – 20 = 5, f = 75, f1 = 45, f2 = 35
Using the formula of mode
Mode = 
= 20 + 150/70
= 20 + 2.14
= 22.14
Hence, the mode = 22.14
(iii)
| Class interval | 25 – 30 | 30 – 35 | 35 – 40 | 40 – 45 | 45 – 50 | 50 – 55 |
| Frequency | 25 | 34 | 50 | 42 | 38 | 14 |
Solution:
From the given table we conclude that
The maximum frequency = 50
So, the modal class = 35 – 40
And,
l = 35, h = 40 – 35 = 5, f = 50, f1 = 34, f2 = 42
Using the formula of mode
Mode = 
= 35 + 80/24
= 35 + 3.33
= 38.33
Hence, the mode = 38.33
Question 4. Compare the modal ages of two groups of students appearing for an entrance test:
| Age in years | 16 – 18 | 18 – 20 | 20 – 22 | 22 – 24 | 24 – 26 |
| Group A | 50 | 78 | 46 | 28 | 23 |
| Group B | 54 | 89 | 40 | 25 | 17 |
Solution:
For Group A:
From the given table we conclude that
The maximum frequency = 78.
So, the model class = 18 – 20
And,
l = 18, h = 20 – 18 = 2, f = 78, f1 = 50, f2 = 46
Using the formula of mode
Mode = 
= 18 + 56/60
= 18 + 0.93
= 18.93 years
For Group B:
From the given table we conclude that
The maximum frequency = 89
The modal class = 18 – 20
And,
l = 18, h = 20 – 18 = 2, f = 89, f1 = 54, f2 = 40
Using the formula of mode
Mode = 
= 18 + 70/84
= 18 + 0.83
= 18.83 years
After finding the mode of both A and B group we conclude that
the modal age of the Group A is greater than Group B.
Question 5. The marks in science of 80 students of class X are given below. Find the mode of the marks obtained by the students in science.
| Marks | 0 – 10 | 10 – 20 | 20 – 30 | 30 – 40 | 40 – 50 | 50 – 60 | 60 – 70 | 70 – 80 | 80 – 90 | 90 – 100 |
| Frequency | 3 | 5 | 16 | 12 | 13 | 20 | 5 | 4 | 1 | 1 |
Solution:
From the given table we conclude that
The maximum frequency = 20
The modal class = 50 – 60
And,
l = 50, h = 60 – 50 = 10, f = 20, f1 = 13, f2 = 5
Using the formula of mode
Mode = 
= 50 + 70/22
= 50 + 3.18
= 53.18
Hence, the mode = 53.18
Question 6. The following is the distribution of height of students of a certain class in a city:
| Height (in cm) | 160 – 162 | 163 – 165 | 166 – 168 | 169 – 171 | 172 – 174 |
| No. of students: | 15 | 118 | 142 | 127 | 18 |
Find the average height of maximum number of students.
Solution:
| Heights (exclusive) | 160 – 162 | 163 – 165 | 166 – 168 | 169 – 171 | 172 – 174 |
| Heights (inclusive) | 159.5 – 162.5 | 162.5 – 165.5 | 165.5 – 168.5 | 168.5 – 171.5 | 171.5 – 174.5 |
| No of students | 15 | 118 | 142 | 127 | 18 |
From the given table we conclude that
The maximum frequency = 142
The modal class = 165.5 – 168.5
And,
l = 165.5, h = 168.5 – 165.5 = 3, f = 142, f1 = 118, f2 = 127
Using the formula of mode
Mode = 
= 165.5 + 72/39
= 165.5 + 1.85
= 167.35 cm
Hence, the average height of maximum number of students = 167.35 cm
Question 7. The following table shows the ages of the patients admitted in a hospital during a year:
| Ages (in years): | 5 – 15 | 15 – 25 | 25 – 35 | 35 – 45 | 45 – 55 | 55 – 65 |
| No of students: | 6 | 11 | 21 | 23 | 14 | 5 |
Find the mode and the mean of the data given above. Compare and interpret the two measures of central tendency.
Solution:
For mean:
Let us considered mean (A) = 30
| Age (in years) | Number of patients fi | Class marks xi | di = xi – 275 | fidi |
| 5 – 15 | 6 | 10 | -20 | -120 |
| 15 – 25 | 11 | 20 | -10 | -110 |
| 25 – 35 | 21 | 30 | 0 | 0 |
| 35 – 45 | 23 | 40 | 10 | 230 |
| 45 – 55 | 14 | 50 | 20 | 280 |
| 55 – 65 | 5 | 60 | 30 | 150 |
| | N = 80 | | |  |
From the table we get
Σfi = N = 80 and Σfi di = 430.
Using the formula of mean

= 30 + 430/80
= 30 + 5.375
= 35.375
= 35.38
Therefore, the mean = 35.38. It represents the average age of the patients = 35.38 years.
For mode:
From the given table we conclude that
The maximum class frequency = 23
So, modal class = 35 – 45
and
l = 35, f = 23, h = 10, f1 = 21, f2 = 14
Using the formula of mode
Mode 
= 35 + 1.81 = 36.8
Hence, the mode = 36.8. It represents the maximum number of patients admitted in hospital of age 36.8 years.
Therefore, mode is greater than mean
Question 8. The following data gives the information on the observed lifetimes (in hours) of 225 electrical components:
| Lifetimes (in hours): | 0 – 20 | 20 – 40 | 40 – 60 | 60 – 80 | 80 – 100 | 100 – 120 |
| No. of components: | 10 | 35 | 52 | 61 | 38 | 29 |
Determine the modal lifetimes of the components.
Solution:
From the given table we conclude that
The maximum class frequency = 61
So, modal class = 60 – 80
and
l = 60, f = 61, h = 20, f1 = 52, f2 = 38
Using the formula of mode
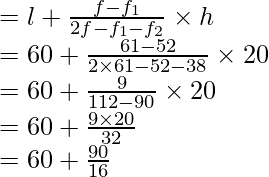
Mode 
= 60 + 5.625 = 65.625
Hence, the modal lifetime of electrical components = 65.625 hours
Question 9. The following table gives the daily income of 50 workers of a factory:
| Daily income | 100 – 120 | 120 – 140 | 140 – 160 | 160 – 180 | 180 – 200 |
| Number of workers | 12 | 14 | 8 | 6 | 10 |
Find the mean, mode, and median of the above data.
Solution:
| Class interval | Mid value (x) | Frequency (f) | fx | Cumulative Frequency |
| 100 – 120 | 110 | 12 | 1320 | 12 |
| 120 – 140 | 130 | 14 | 1820 | 26 |
| 140 – 160 | 150 | 8 | 1200 | 34 |
| 160 – 180 | 170 | 6 | 1000 | 40 |
| 180 – 200 | 190 | 10 | 1900 | 50 |
| | | N = 50 |  | |
Finding Mean:
From the table we get
N = 50, fx = 7260
So using mean formula, we get
Mean = Σfx / N
= 7260/ 50
= 145.2
Hence, the mean = 145.2
Finding Median:
N/2 = 50/2 = 25
So, the cumulative frequency just greater than N/2 = 26,
The median class = 120 – 140
Such that l = 120, h = 140 – 120 = 20, f = 14, F = 12
By using the formula of median we get
Median = 
= 120 + 260/14
= 120 + 18.57
= 138.57
Hence, the median = 138.57
Finding Mode:
From the table we get
The maximum frequency = 14,
So the modal class = 120 – 140
And,
l = 120, h = 140 – 120 = 20, f = 14, f1 = 12, f2 = 8
By using the formula of mode we get
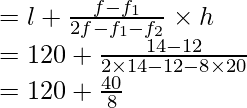
Mode = 
= 120 + 5
= 125
Hence, the mode = 125
Question 10. The following distribution gives the state-wise teachers-students ratio in higher secondary schools of India. Find the mode and mean of this data. Interpret the two measures:
Number of students per teacher
| Number of states/U.T
|
15 – 20
| 3
|
20 – 25
| 8
|
25 – 30
| 9
|
30 – 35
| 10
|
35 – 40
| 3
|
40 – 45
| 0
|
45 – 50
| 0
|
50 – 55
| 2
|
Solution:
From the given table we conclude that
The maximum class frequency = 10
So, modal class = 30 – 35
and
l = 30, h = 5, f = 10, f1 = 9, f2 = 3
By using the formula of mode we get
Mode = l + f – f1 2f – f1 – f2 × hl + 
= 30 + 120 – 12 × 530 + 
= 30 + 120 – 12 × 530 + 
= 30 + 5/8
= 30.625
Hence, the mode = 30.6 and it represents that most of states/ U.T have a teacher-students ratio = 30.6
Now we are going to find class marks using the following formula
Class mark = 
Let us considered mean(a) = 32.5, and now we are going to find di, ui, and fiui as following
| Number of students per teacher | Number of states/ U.T (fi) | xi | di = xi – 32.5 | Ui | fiui |
| 15 – 20 | 3 | 17.5 | -15 | -3 | -9 |
| 20 – 25 | 8 | 22.5 | -10 | -2 | -16 |
| 25 – 30 | 9 | 27.5 | -5 | -1 | -9 |
| 30 – 35 | 10 | 32.5 | 0 | 0 | 0 |
| 35 – 40 | 3 | 37.5 | 5 | 1 | 3 |
| 40 – 45 | 0 | 42.5 | 10 | 2 | 0 |
| 45 – 50 | 0 | 47.5 | 10 | 2 | 0 |
| 50 – 55 | 2 | 52.5 | 20 | 4 | 8 |
| Total | 35 | | | | -23 |
Using the mean formula, we get

= 32.5 – 23/7
= 32.5 – 3.28
= 29.2
Hence, the mean = 29.2 and it represents that on an average teacher-student ratio = 29.2.
Share your thoughts in the comments
Please Login to comment...