Interpreting and visualizing feature maps in PyTorch is like looking at snapshots of what’s happening inside a neural network as it processes information. In this Tutorial, we will walk through interpreting and visualizing feature maps in PyTorch.
What are Feature Maps?
Feature maps enable us to capture the output activations of convolutional layers, providing insights into how the network processes and interprets input data at various stages.
- Feature maps are the outputs of particular filters or kernels that are applied to an input image using convolutional layers in a convolutional neural network (CNN).
- These feature maps assist in capturing the different facets or patterns present in the input image.
- Each feature map highlights specific features, such as edges, textures, or other higher-level features that the network has learned.
Need For Visualizing Feature Maps
Visualizing feature maps is a crucial aspect of understanding and interpreting the behavior of convolutional neural networks (CNNs) in the field of deep learning.
- Feature maps make it easier to understand what features are being detected at different network layers.
- It provides opinions about how the network analyzes incoming data and extracts relevant information.
- The visualization of a network is crucial for developing intuition about its inner workings as well as for debugging and optimizing CNN architectures.
- To understand how the network learns and extracts hierarchical representations, compare feature maps from various layers.
Visualizing Feature Maps in PyTorch
The network that processes data has the ability to look at feature maps and determine what the network is concentrating on. By traversing the network’s layers, PyTorch framework facilitates easy access to these snapshots. We will visualize and interpret the feature maps for an image classification task using a pre-trained CNN model “VGG16”.
Steps to consider:
- Make sure that the values in the snapshots are in good range for visualisation.
- It’s more like adjusting the brightness or contrast in a photo to see it more clearly.
Let’s dive into the implementation and visualize the feature maps using PyTorch.
Install Required Libraries
pip install torch torchvision
# Installing the PyTorch Library
Importing Necessary Libraries
- Torch : The fundamental PyTorch library facilitates the development of deep learning models by offering multi-dimensional tensors and mathematical operations.
- torch.nn : It is a PyTorch submodule that includes layers, loss functions, and neural network modules.
- VGG16 : The pretrained dataset can be accessed through the torchvision library.
- Transforms :To provide common image transformations like resizing, cropping, and normalization to preprocess images before feeding them into neural networks, Torchvision has additional modules.
Python
import torch
import torch.nn as nn
from torchvision import models, transforms
from PIL import Image
import matplotlib.pyplot as plt
|
Define the image transformations
In order to prepare images for neural network input, this will define a set of image transformations, such as resizing, converting to a PyTorch tensor, and normalization with zero mean and unit variance.
Resizing the images to a specific size (e.g., 224×224 pixels), converting them into PyTorch tensors, and normalizing the pixel values are some of the image transformations applied to the input images in the feature map code that is available.
Python
image_transform = transforms.Compose([
transforms.Resize((224, 224)),
transforms.ToTensor(),
transforms.Normalize(mean=0., std=1.)
])
|
Load the image and plot it using Matplotlib
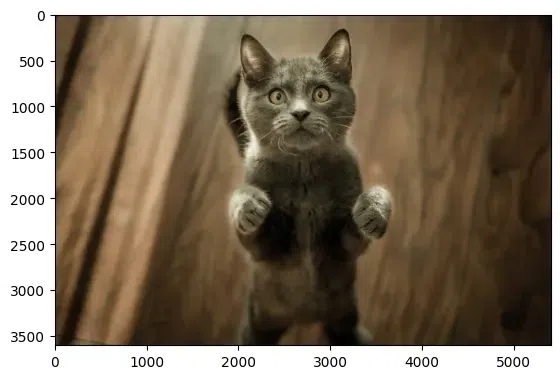
Load the image and plot the image. Image link used in the tutorial.
Python
input_image = Image.open(str('/content/cat.jpg'))
plt.imshow(input_image)
plt.show()
|
Output:
Load the model and extract convolutional layers and its respective weights
Here, we are using pre-trained VGG16 model provided by a deep learning framework. The vgg16 function is used to instantiate the VGG16 model, and pretrained=True is used to import the pre-trained weights that were trained on a large dataset (e.g., ImageNet).
To extract information about convolutional layers and their weights, we are initializing some variables to store information about the convolutional layers and their weights in the VGG16 model like:
conv_weights will be used to store the weights of the convolutional layers.conv_layers will be used to store the convolutional layers themselves.total_conv_layers is a counter initialized to zero, which will be used to keep track of the total number of convolutional layers in the model.
Python
pretrained_model = models.vgg16(pretrained=True)
conv_weights = []
conv_layers = []
total_conv_layers = 0
|
Traversing through the model to extract layers
The purpose of this code is to iterate through the layers of the features module, identify the convolutional layers, and store both the convolutional layers and their corresponding weights in the conv_layers and conv_weights lists, respectively.
Python
for module in pretrained_model.features.children():
if isinstance(module, nn.Conv2d):
total_conv_layers += 1
conv_weights.append(module.weight)
conv_layers.append(module)
print(f"Total convolution layers: {total_conv_layers}")
|
Output:
Total convolution layers: 13
Choose the GPU or CPU according to the need and extract features.
Plotting multiple feature maps in a grid layout, each with its corresponding title extracted from layer names, and saves the plot as a result.
- The
input_image is preprocessed using the image_transform function.
input_image.unsqueeze(0) adds a batch dimension to the input image. Deep learning models usually expect input data in batches, even if the batch size is 1.
The process extracts the feature maps produced by each convolutional layer.
Python
device = torch.device('cuda' if torch.cuda.is_available() else 'cpu')
pretrained_model = pretrained_model.to(device)
input_image = image_transform(input_image)
input_image = input_image.unsqueeze(0)
input_image = input_image.to(device)
feature_maps = []
layer_names = []
for layer in conv_layers:
input_image = layer(input_image)
feature_maps.append(input_image)
layer_names.append(str(layer))
|
Display feature maps shapes
Python
print("\nFeature maps shape")
for feature_map in feature_maps:
print(feature_map.shape)
processed_feature_maps = []
for feature_map in feature_maps:
feature_map = feature_map.squeeze(0)
mean_feature_map = torch.sum(feature_map, 0) / feature_map.shape[0]
processed_feature_maps.append(mean_feature_map.data.cpu().numpy())
|
Feature maps shape
torch.Size([1, 64, 224, 224])
torch.Size([1, 64, 224, 224])
torch.Size([1, 128, 224, 224])
torch.Size([1, 128, 224, 224])
torch.Size([1, 256, 224, 224])
torch.Size([1, 256, 224, 224])
torch.Size([1, 256, 224, 224])
torch.Size([1, 512, 224, 224])
torch.Size([1, 512, 224, 224])
torch.Size([1, 512, 224, 224])
torch.Size([1, 512, 224, 224])
torch.Size([1, 512, 224, 224])
torch.Size([1, 512, 224, 224])
Process and Plot feature maps and shapes
Python
print("\n Processed feature maps shape")
for fm in processed_feature_maps:
print(fm.shape)
fig = plt.figure(figsize=(30, 50))
for i in range(len(processed_feature_maps)):
ax = fig.add_subplot(5, 4, i + 1)
ax.imshow(processed_feature_maps[i])
ax.axis("off")
ax.set_title(layer_names[i].split('(')[0], fontsize=30)
|
Output:
 Processed feature maps shape
(224, 224)
(224, 224)
(224, 224)
(224, 224)
(224, 224)
(224, 224)
(224, 224)
(224, 224)
(224, 224)
(224, 224)
(224, 224)
(224, 224)
(224, 224)
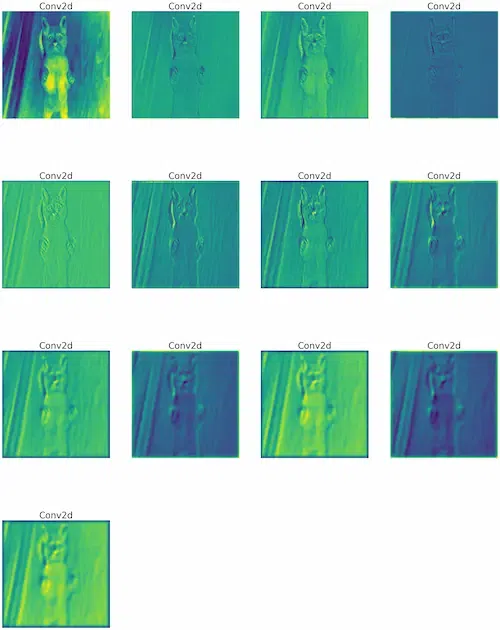
The text “Conv2d” is indicating convolutional layers, which are essential building blocks for CNNs. The number of repetitions (four times in each row) represents the number of filters used in the convolutional layers.
Conclusion
Through the examination of feature maps, scholars and professionals can acquire significant understanding of network behavior, pinpoint the advantages and disadvantages of models, and enhance network architectures for enhanced interpretability and efficiency.
Share your thoughts in the comments
Please Login to comment...