A Deployment Diagram in software engineering is a type of Structural UML Diagram that shows the physical deployment of software components on hardware nodes. It illustrates the mapping of software components onto the physical resources of a system, such as servers, processors, storage devices, and network infrastructure.

Important Topics for the Deployment Diagram
What is a Deployment Diagram?
A Deployment Diagram illustrates how software architecture, designed on a conceptual level, translates into the physical system architecture where the software will run as nodes. It maps out the deployment of software components onto hardware nodes and depicts their relationships through communication paths, enabling a visual representation of the software’s execution environment across multiple nodes.
Key elements of a Deployment Diagram
1. Nodes
These represent the physical hardware entities where software components are deployed, such as servers, workstations, routers, etc.
2. Components
Represent software modules or artifacts that are deployed onto nodes, including executable files, libraries, databases, and configuration files.
3. Artifacts
Physical files deployed onto nodes, embodying the actual implementation of software components, such as executables, scripts, databases, etc.
4. Dependencies
Reflect relationships or connections between nodes and components, indicating communication paths, deployment constraints, or other dependencies.
5. Associations
Show relationships between nodes and components, signifying that a component is deployed on a particular node, thus mapping software components to physical nodes.
6. Deployment Specification
Describes the configuration and properties of nodes and components, encompassing hardware specifications, software configurations, communication protocols, etc.
7. Communication Paths
Represent channels or connections facilitating communication between nodes and components, including network connections, communication protocols, etc.
Notations in Deployment Diagram
Refers to the symbols, shapes, and conventions used to represent different elements within the diagram, like:
1. Component

A component represents a modular and reusable part of a system, typically implemented as a software module, class, or package. It encapsulates its behavior and data and can be deployed independently.
Typically represented as a rectangle with two smaller rectangles protruding from its sides, indicating ports for connections. The component’s name is written inside the rectangle.
2. Artifact
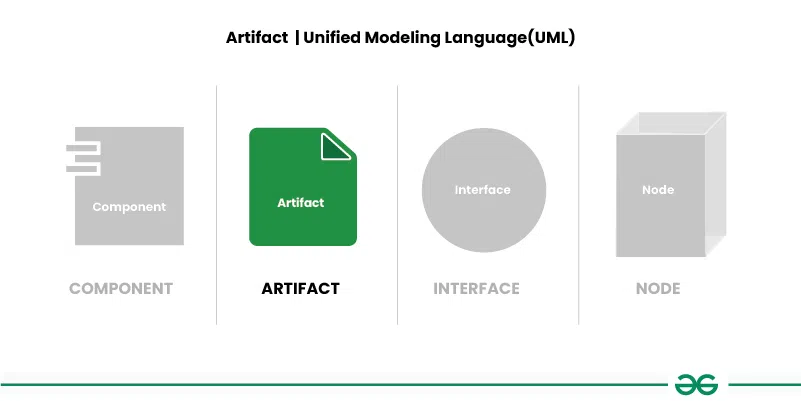
An artifact represents a physical piece of information or data that is used or produced in the software development process. It can include source code files, executables, documents, libraries, configuration files, or any other tangible item.
Typically represented as a rectangle with a folded corner, labeled with the artifact’s name. Artifacts may also include additional information, such as file extensions or versions.
3. Interface

An interface defines a contract specifying the methods or operations that a component must implement. It represents a point of interaction between different components or subsystems.
Represented as a circle or ellipse labeled with the interface’s name. Interfaces can also include provided and required interfaces, denoted by “+” and “-” symbols, respectively.
4. Node
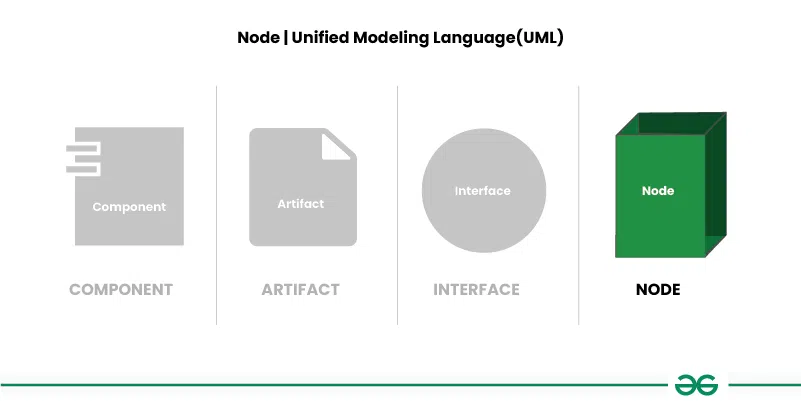
A node represents a physical or computational resource, such as a hardware device, server, workstation, or computing resource, on which software components can be deployed or executed.
Represented as a box with rounded corners, usually labeled with the node’s name. Nodes can also include nested nodes to represent hierarchical structures.
5. Communication path

A straight line that represents communication between two device nodes. Dashed lines in deployment diagrams often signify relationships or dependencies between elements, indicating that one element is related to or dependent on another.
Use Cases of Deployment Diagrams
- System Planning: Deployment diagrams help plan how software systems will be set up on different devices. They show where each part of the system will go.
- Infrastructure Design: They help design the hardware needed to support the software. By showing which software parts go where, they help decide what devices and networks are needed.
- Resource Allocation: Deployment diagrams make sure each part of the software has enough resources, like memory or processing power, to run well.
- Dependency Analysis: They show how different parts of the software depend on each other and on the hardware. This helps understand how changes might affect the whole system.
- Performance Optimization: By seeing how everything is set up, teams can find ways to make the software run faster and smoother.
- Security Planning: Deployment diagrams help plan how to keep the system safe from hackers or other threats by showing where security measures are needed.
- Documentation: They provide a visual guide to how the system is set up, making it easier to understand and manage.
Steps for creating a Deployment Diagram
- Step1: Identify Components: List all software parts and hardware devices that will be in the deployment diagram.
- Step 2: Understand Relationships: Figure out how these parts connect and work together.
- Step 3: Gather Requirements: Collect details about hardware, network setups, and any special rules for deployment.
- Step 4: Draw Nodes and Components: Start by drawing the hardware devices (nodes) and software parts (components) using standard symbols roughly at first improvise it and draw the final one.
- Step 5: Connect Nodes and Components: Use lines or arrows to show how nodes and components are linked, indicating how they talk to each other.
- Step 6: Add Details: Label everything clearly and include any extra info, like hardware specs or communication protocols.
- Step 7: Documentation: Write down any important decisions or assumptions made while creating the diagram.
Deployment Patterns
Deployment patterns are standardized methods or recommended practices used for efficiently deploying software onto hardware infrastructure. These patterns offer guidance and established strategies for organizing and deploying software components across various environments. By tackling common deployment challenges like scalability, reliability, performance, and maintainability, deployment patterns streamline the deployment process and enhance system efficiency.
- Client-Server Deployment: By visually depicting client applications connected to server nodes, the diagram can illustrate the client-server architecture commonly used in many systems.
- Three-Tier Architecture: The deployment diagram can show how presentation, application logic, and data storage components are distributed across different nodes, reflecting the three-tier architecture.
- Microservices Architecture: If the system is designed using a microservices architecture, the deployment diagram can illustrate how individual microservices are deployed onto separate nodes or containers.
- Containerization: If containerization technologies like Docker are used, the deployment diagram can show how different containers are deployed onto host machines.
- Cloud Deployment: If the system is deployed in a cloud environment, the diagram can illustrate how components are deployed across different cloud services or regions.
Real-World Examples For Deployment Diagram
Example 1
Deployement Diagram For Mobile Banking Andorid Services.
In a deployment diagram, nodes represent the different devices or hardware components in a system. In this specific example, the node represents the client’s Android device. The components, on the other hand, represent the software components installed on these devices. In this case, the component represents the banking application installed on the Android device.
- The diagram also illustrates how the user interacts with the banking server through the web.
- This interaction involves the user accessing the banking application on their Android device, which then communicates with the application server over the web to perform various banking tasks, such as checking account balances or transferring funds.
- Overall, the deployment diagram provides a visual representation of how the software components are deployed on the hardware nodes and how these components interact with each other to provide the desired functionality to the user.
.webp)
Example 2
Deployement Diagram For Online Exam Registration System.
The online exam registration process typically includes a series of features designed to streamline and simplify the registration experience for users. After logging in or registering for an account, users can browse and select their desired exam from a list of available options.
.webp)
Explanation of the above example:
- Login or Registration for exam: This is the first step where users need to provide their credentials to access the exam registration system. If a user is new, they need to register by providing necessary details like name, email, contact number, etc.
- Select exam: After successful login or registration, users can select the exam they wish to register for. This might involve choosing from a list of available exams, checking exam dates and locations, and ensuring eligibility criteria are met.
- Manage profile and status: Users can manage their profiles, such as updating contact information, viewing their registration status, and printing e-receipts.
View Profile
- View Profile: Here you can Access registered info and Confirm the given accuracy information. Update the contact data and needed Print the e-receipt, also save all the details as – Save profile
- Payment: Once the exam is selected, users proceed to the payment page to make the necessary fee payment. This could be done through various online payment methods like credit/debit cards, net banking, digital wallets, etc.
- Test: Post-registration and payment, users can access sample tests or practice papers if available, to prepare for the exam.
- View result: After the exam, users can view their results on the website by logging in to their account.
- Report: Users might have access to various reports like scorecards, response sheets, or feedback forms, depending on the exam and the policies of the examination board.
Integration of Deployment Diagrams with Other UML Diagrams
Integration of Deployment Diagrams with other UML diagrams helps in providing a comprehensive view of the system, showing both the logical structure (as depicted in other UML diagrams) and the physical deployment of the system components.
- Use Case Diagrams: Deployment diagrams can be related to use case diagrams to show which hardware nodes are involved in each use case. This helps in understanding the physical infrastructure needed to support different use cases.
- Class Diagrams: Deployment diagrams can be linked to class diagrams to show how classes are distributed across different nodes. This helps in understanding the distribution of software components in the system.
- Sequence Diagrams: Deployment diagrams can be connected to sequence diagrams to illustrate how messages flow between objects in different nodes. This helps in understanding the network communication between different parts of the system.
- Component Diagrams: Deployment diagrams can be linked to component diagrams to show how components are deployed on nodes. This helps in understanding the physical distribution of components in the system.
- Activity Diagrams: Deployment diagrams can be related to activity diagrams to show how activities are distributed across nodes. This helps in understanding the distribution of processing power in the system.
Benefits of Deployment Diagrams
- Visual Representation: Deployment diagrams provide a clear picture of how software parts are placed on hardware, making it easy to understand the system’s structure.
- Communication Tool: They help teams talk about how to set up the system, making it easier to discuss and decide on deployment strategies.
- Planning and Management Aid: Deployment diagrams assist in planning and managing the deployment process, ensuring resources are used efficiently and system requirements are met.
- Documentation Support: They serve as useful documentation for understanding how the system is set up, helping with maintenance and future changes.
- Analysis and Optimization: Deployment diagrams help analyze and improve system performance by identifying potential issues and optimizing resource usage.
- Testing and Validation Planning: They aid in planning integration testing and ensuring the deployed system functions correctly.
Challenges of Deployment Diagrams
- Complexity: Deployment diagrams can get complicated, especially in big systems with lots of parts. Managing this complexity is tough.
- UML Know-How: Making and understanding deployment diagrams needs knowledge of UML symbols, which not everyone might have.
- Keeping Up-to-Date: Updating deployment diagrams when the system changes takes time and effort.
- Dynamic Stuff: Deployment diagrams might not show how things change over time or in real-life use.
- Team Coordination: Making deployment diagrams often needs lots of people to work together, which can be tricky.
- Scope Limitations: Deployment diagrams might miss some important stuff, like security details or outside connections.
- Tool Problems: Sometimes, the software used to make deployment diagrams has limitations, making it harder to use or work with.
Conclusion
Deployment diagrams are important tools used in software engineering to show how software pieces are placed on hardware. They help us see things clearly, communicate better, plan deployment, find what depends on what, document our setup, and improve performance. But they can also be tricky to make and keep updated. Overall, they’re really useful for understanding and managing how software is set up and run.
Share your thoughts in the comments
Please Login to comment...