Collaboration Diagrams | Unified Modeling Language(UML)
Last Updated :
08 Mar, 2024
In UML (Unified Modeling Language), a Collaboration Diagram is a type of Interaction Diagram that visualizes the interactions and relationships between objects in a system. It shows how objects collaborate to achieve a specific task or behavior. Collaboration diagrams are used to model the dynamic behavior of a system and illustrate the flow of messages between objects during a particular scenario or use case.

Important Topics for Collaboration Diagrams
What are Collaboration Diagrams?
A collaboration diagram, within the Unified Modeling Language (UML), is a behavioral diagram which is also referred to as a communication diagram, It illustrates how objects or components interact with each other to achieve specific tasks or scenarios within a system.
In simpler terms, they visually represents the interactions between objects or components in a system, showing how they collaborate to accomplish tasks or scenarios and depicts the interconnections among multiple objects within a system, illustrating the system’s object architecture.
Importance of Collaboration Diagrams
Collaboration diagrams play a crucial role in system development by facilitating understanding, communication, design, analysis, and documentation of the system’s architecture and behavior.
- Visualizing Interactions:
- These diagrams offer a clear visual representation of how objects or components interact within a system.
- This visualization aids stakeholders in comprehending the flow of data and control, fostering easier understanding.
- Understanding System Behavior:
- By depicting interactions, collaboration diagrams provide insights into the system’s dynamic behavior during operation.
- Understanding this behavior is crucial for identifying potential issues, optimizing performance, and ensuring the system functions as intended.
- Facilitating Communication:
- Collaboration diagrams serve as effective communication tools among team members.
- They facilitate discussions, enabling refinement of the system’s design, architecture, and functionality. Clearer communication fosters better collaboration and alignment.
- Supporting Design and Analysis:
- These diagrams assist in designing and analyzing system architecture and functionality.
- They help identify objects, their relationships, and message exchanges, which is vital for creating efficient and scalable systems.
- Documentation Purposes:
- Collaboration diagrams serve as valuable documentation assets for the system.
- They offer a visual representation of the system’s architecture and behavior, serving as a reference for developers, testers, and other stakeholders throughout the development process.
Components and their Notations in Collaboration Diagrams
In collaboration diagrams there are several notations that are used to represent :
1. Objects/Participants
Objects are represented by rectangles with the object’s name at the top. Each object participating in the interaction is shown as a separate rectangle in the diagram. Objects are connected by lines to indicate messages being passed between them.
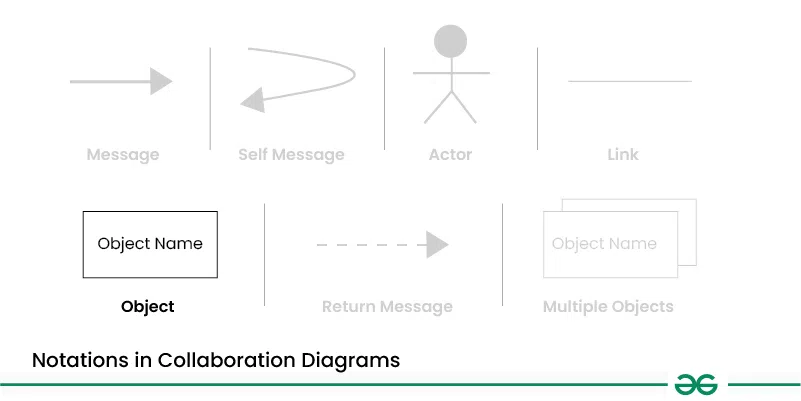
2. Multiple Objects
Multiple objects are represented by rectangles, each with the object’s name inside, and interactions between them are shown using arrows to indicate message flows.

3. Actors
They are usually depicted at the top or side of the diagram, indicating their involvement in the interactions with the system’s objects or components. They are connected to objects through messages, showing the communication with the system.

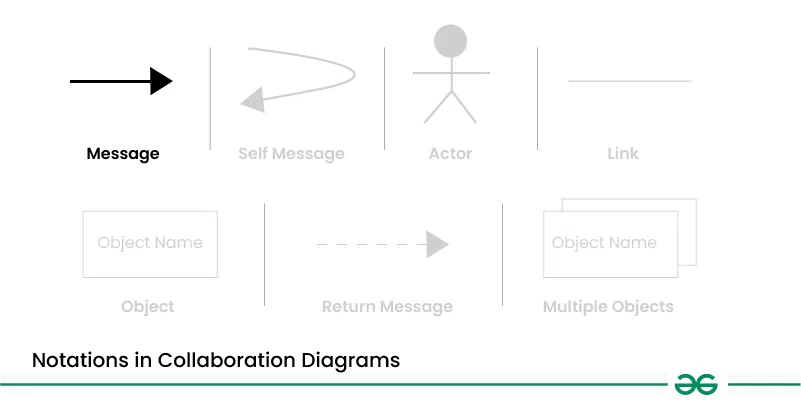
4. Messages
Messages represent communication between objects. Messages are shown as arrows between objects, indicating the flow of communication. Each message may include a label indicating the type of message (e.g., method call, signal). Messages can be asynchronous (indicated by a dashed arrow) or synchronous (solid arrow).
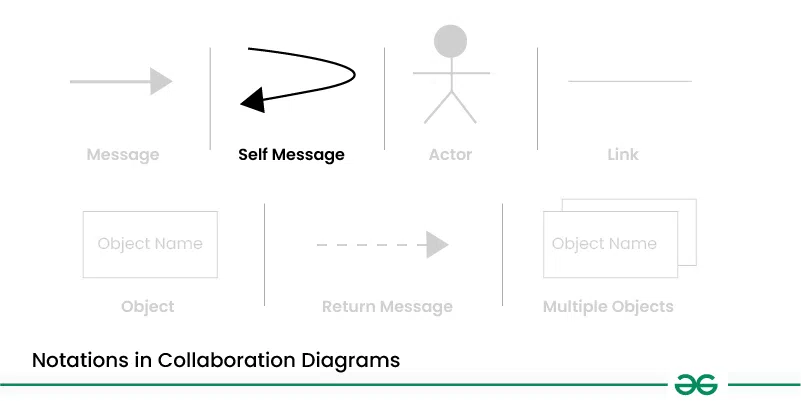
5. Self Message
This is a message that an object sends to itself. It represents an action or behavior that the object performs internally, without involving any other objects. Self-messages are useful for modeling scenarios where an object triggers its own methods or processes.
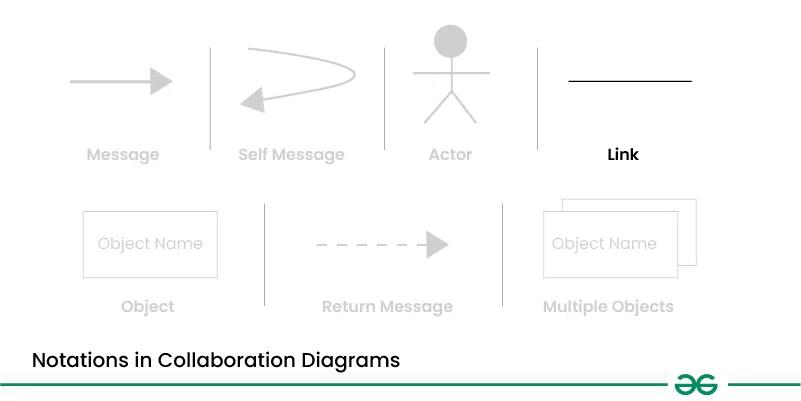
6. Links
Links represent associations or relationships between objects. Links are shown as lines connecting objects, with optional labels to indicate the nature of the relationship. Links can be uni-directional or bi-directional, depending on the nature of the association.
7. Return Messages
Return messages represent the return value of a message. They are shown as dashed arrows with a label indicating the return value. Return messages are used to indicate that a message has been processed and a response is being sent back to the calling object.

How to draw Collaboration Diagrams ?
To draw a collaboration diagram:
- Step 1: Identify Objects/Participants: Begin by identifying the objects or participants involved in the system. These can be classes, modules, actors, or any other relevant entities.
- Step 2: Define Interactions: Determine how these objects interact with each other to accomplish tasks or scenarios within the system. Identify the messages exchanged between objects during these interactions.
- Step 3: Add Messages: Draw arrows between lifelines to represent the messages exchanged between objects. Label each arrow with the name of the message and, if applicable, any parameters or data being transmitted.
- Step 4: Consider Relationships: If there are associations or dependencies between objects, represent them using appropriate notations, such as dashed lines or arrows.
- Step 5: Documentation: Once finalized, document the collaboration diagram along with any relevant explanations or annotations. Ensure that the diagram effectively communicates the system’s interactions to stakeholders.
Use cases of Collaboration Diagrams
- Software Development: Collaboration diagrams help developers understand how different parts of a system interact, aiding in building and testing software.
- System Analysis and Design: They assist in visualizing system interactions, aiding analysts and designers in refining system architecture.
- Team Communication: Collaboration diagrams facilitate team discussions and decision-making by providing a clear visual representation of system interactions.
- Documentation: They are essential for documenting system architecture and design decisions, serving as valuable reference material for developers and testers.
- Debugging and Troubleshooting: Collaboration diagrams help trace message flow and identify system issues, aiding in debugging and troubleshooting efforts.
Real-World Example of Collaboration Diagram
Let’s understand collaboration diagram using the example of Job Recruitment System.
The recruiter object interacts with the database object to verify the login, check the jobs, select a talented applicant, and send interview details.
- The applicant object interacts with the database object to provide details and attend the test.
- The collaboration diagram shows the sequential order of these interactions and the relationship between the objects involved.
.webp)
1. Applicant
This object represents the job candidate who applies for a job position. The Applicant object interacts with the Recruiter object to provide personal and professional details and attend the interview. After the interview, the Recruiter object selects the talented applicant and sends a joining letter to the Applicant object.
Applicant –attend test –> Database
Applicant –provide details –> Database
2. Recruiter
This object represents the person or system responsible for hiring new employees. The Recruiter object interacts with the Applicant object to verify the login, check the job positions, select the talented applicant, send interview details, and send the joining letter. The Recruiter object also interacts with the Database object to retrieve and update the necessary information.
Recruiter –verify login–> Database
Recruiter <– confirms login –> Database
Recruiter –check jobs positions –> Database
Recruiter –select talented applicant –> Applicant
Recruiter –send interview details –> Applicant
Recruiter –send joining letter –> Applicant
3. Database
This object represents the system or component that stores the necessary information for the recruitment process. The Database object interacts with the Recruiter object to provide the job positions, verify the login, and send the necessary details about the applicants. The Database object also interacts with the Applicant object to store and retrieve the necessary details about the applicants.
Database –send jobs –> Recruiter
When to use Collaboration Diagram
Collaboration diagrams in UML are typically used in the early stages of software development to:
- Model Interaction: They are used to model the interaction between objects in a system, showing how objects collaborate to achieve a specific task or behavior.
- Clarify Requirements: Collaboration diagrams help clarify the requirements of a system by visualizing how objects interact with each other to fulfill specific functionalities.
- Design Communication Patterns: They help in designing the communication patterns between objects, including the sequence of messages exchanged between them.
- Identify Potential Issues: By visualizing the interactions between objects, collaboration diagrams can help identify potential issues or bottlenecks in the system’s design.
- Communicate Design: They are useful for communicating the design of a system to stakeholders, including developers, designers, and project managers.
Overall, collaboration diagrams are a valuable tool for understanding, designing, and communicating the dynamic aspects of a system’s behavior.
Benefits of Collaboration Diagrams
- Clear Understanding: Collaboration diagrams make it easy to understand how system components interact, reducing confusion among team members.
- Effective Communication: They facilitate discussions and decision-making by providing a visual representation of system interactions that everyone can understand.
- Visual Aid( Clarity ): Collaboration diagrams help visualize the flow of data and control within the system, aiding in system analysis, design, and documentation.
- Debugging Support: Collaboration diagrams assist in debugging by revealing the sequence of interactions and potential sources of errors.
- Documentation Assistance: They serve as useful documentation, capturing system architecture and design decisions for reference throughout the development process.
- Efficiency Improvement: By streamlining development and reducing misunderstandings, collaboration diagrams improve overall efficiency in system development and maintenance.
Challenges of Collaboration Diagrams
- Complexity: Keeping collaboration diagrams clear in large systems with many objects and interactions can be tough.
- Ambiguity: Sometimes, interpreting the interactions in diagrams isn’t straight forward, leading to mis-understandings.
- Dynamic Systems: Diagrams might not fully capture systems where interactions change over time, like those with continously processing and improvising.
- Scalability: Managing diagrams becomes harder as systems grow, requiring efforts to keep them manageable.
- Maintainability: Updating diagrams to reflect system changes can be challenging, especially in large and fast evolving systems.
- Communication: Ensuring that diagrams effectively convey complex interactions to all stakeholders can be challenging.
Share your thoughts in the comments
Please Login to comment...