Variable importance plot using random forest package in R
Last Updated :
21 Nov, 2022
As the name indicates Variable Importance Plot is a which used random forest package to plot the graph based on their accuracy and Gini Coefficient. If the accuracy of the variable is high then it’s going to classify data accurately and Gini Coefficient is measured in terms of the homogeneity of nodes in a random forest. And the Mean Decrease Accuracy and Mean Decrease Gini Coefficient are directly proportional to each other.
Variable importance plot using random forest package in R
Step 1: Install and load the required package.
R
install.packages("randomForest")
library(randomForest)
|
Step 2: Load the iris dataset.
Output:
Sepal.Length Sepal.Width Petal.Length Petal.Width    Species
1            5.1         3.5          1.4         0.2     setosa
2            4.9         3.0          1.4         0.2     setosa
3            4.7         3.2          1.3         0.2     setosa
4            4.6         3.1          1.5         0.2     setosa
5            5.0         3.6          1.4         0.2     setosa
Step 3: Next we are going to classify the dataset using the randomForest() function based on results obtained from multiple decision trees.
Syntax: randomForest(data,subset,ntree,keep.forest,importance,proximity)
Where,
- data – data frame which need to classified
- subset – column/ rows of that data frame should be used to classify
- ntree – number of trees to be grown is specified here
- keep.forest – set to TRUE if the forest need to retained in the output object
- importance – set to TRUE if predictors to be assessed based on importance else FALSE
- proximity – set to TRUE if proximity measure of rows to be considered or not
R
rand_frst <- randomForest(iris, data=iris, ntree=100, keep.forest=FALSE,
importance=TRUE)
|
Step 4: Finally, using the varImpPlot() function we are going to plot the graph.
Syntax: varImpPlot(x,sort,main)
Where,
- x – Object of randomForest class is specified here
- sort – Sorting order of variables is specified here(by default TRUE)
- main – title of the plot is specified here
R
randomForest::varImpPlot(rand_frst,
sort=FALSE,
main="Variable Importance Plot")
|
Output:
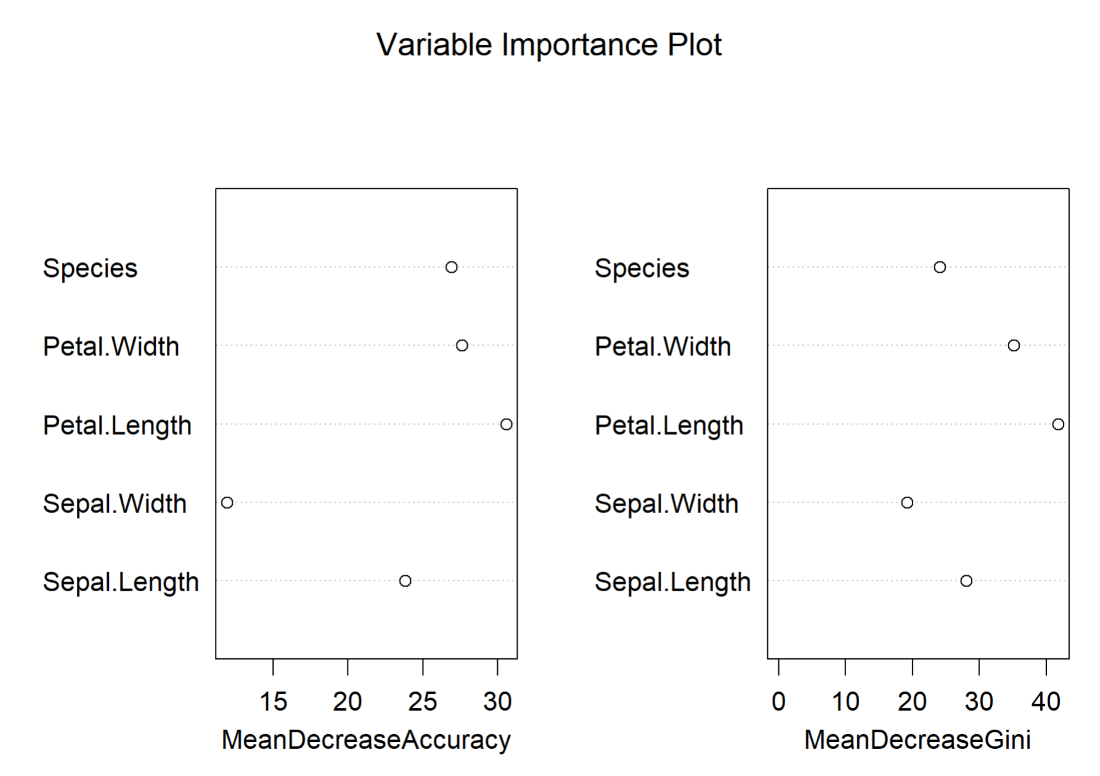
Variable importance plot for iris dataset
Share your thoughts in the comments
Please Login to comment...