Change Color of Bars in Barchart using ggplot2 in R
Last Updated :
06 Jun, 2021
In this article, we are going to see various methods to change the color of a bar chart using ggplot2 in the R programming language.
For creating a simple bar plot we will use the function geom_bar( ).
Syntax:
geom_bar(stat, fill, color, width)
Parameters :
- stat : Set the stat parameter to identify the mode.
- fill : Represents color inside the bars.
- color : Represents color of outlines of the bars.
- width : Represents width of the bars.
Dataset in Use:
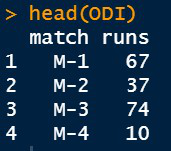
Let us first plot a regular barplot to display what a regular plot without any help will be printed.
Example:
R
library(ggplot2)
ODI <- data.frame(match=c("M-1","M-2","M-3","M-4"),
runs=c(67,37,74,10))
perf <-ggplot(data=ODI, aes(x=match, y=runs))+
geom_bar(stat="identity")
perf
perf+coord_flip()
|
Output:
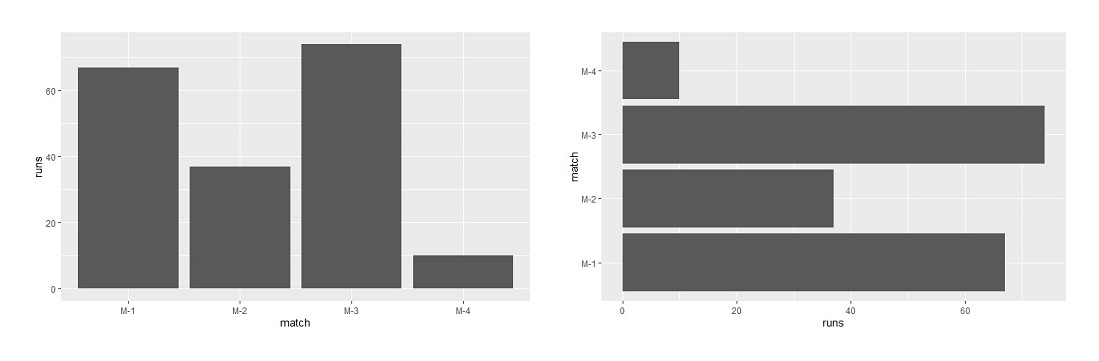
Bar Plot
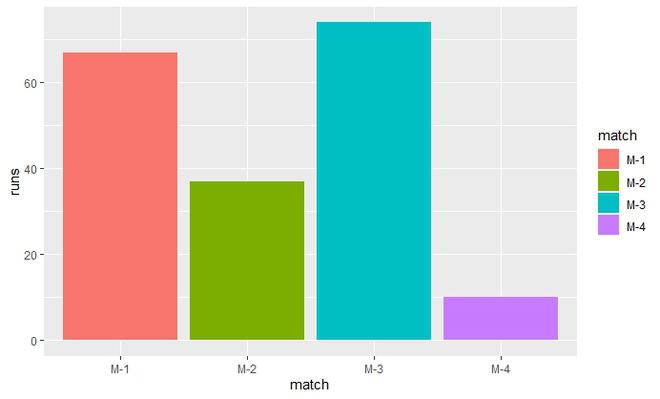
Now let us see how colors are added to the barplot.
Method 1: Using default colors
Use the command fill to add color inside the bars. Since, the bars are in different x-axis values we need to assign the x-axis variable to the fill. In our case, match is in the x-axis, so we write fill=match. You need to write this command inside the aes() also known as the quoting function or aesthetic function under the ggplot2 library.
Example:
R
library(ggplot2)
ODI <- data.frame(match=c("M-1","M-2","M-3","M-4"),
runs=c(67,37,74,10))
perf <-ggplot(data=ODI, aes(x=match, y=runs,fill=match))+
geom_bar(stat="identity")
perf
|
Output:
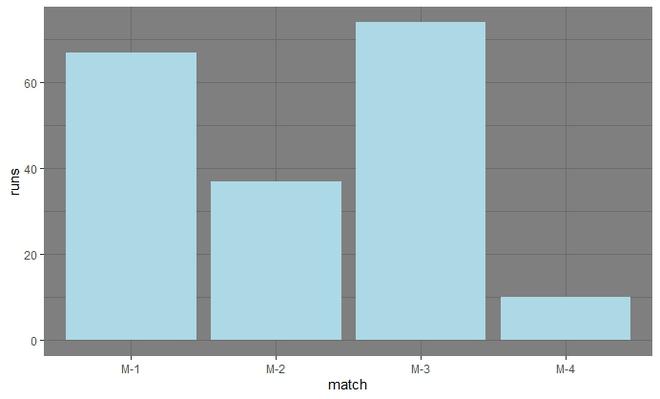
Use the same fill. But this time since we have to assign a single color we will use it inside the geom_bar( ). Then assign the color of your choice to the fill as shown below. The theme is changed because some color plots might not be visible to the default theme in R.
Example:
R
library(ggplot2)
ODI <- data.frame(match=c("M-1","M-2","M-3","M-4"),
runs=c(67,37,74,10))
perf <-ggplot(data=ODI, aes(x=match, y=runs))+
geom_bar(stat="identity",fill="lightblue")+
theme_dark()
perf
|
Output:
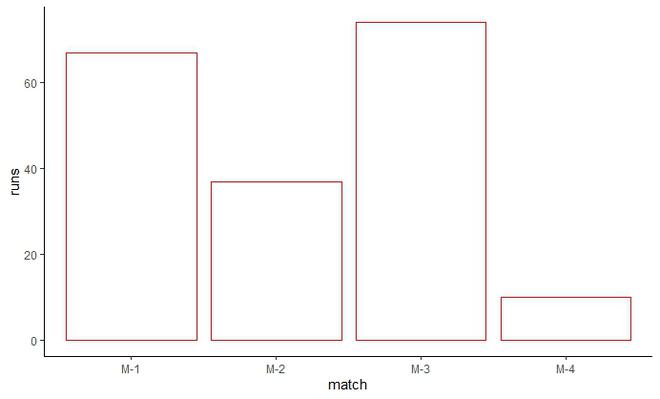
Here we need a command color for assigning colors to the outline. Outline colors look good when the fill color is white. It is the property of color because some colors overshadow other colors or if we assign same color to fill and outline both. Since we need the same fill and the same outline we will write these commands inside the geom_bar( ).
Example:
R
library(ggplot2)
ODI <- data.frame(match=c("M-1","M-2","M-3","M-4"),
runs=c(67,37,74,10))
perf <-ggplot(data=ODI, aes(x=match, y=runs))+
geom_bar(stat="identity",color="red",fill="white")+
theme_classic()
perf
|
Output:
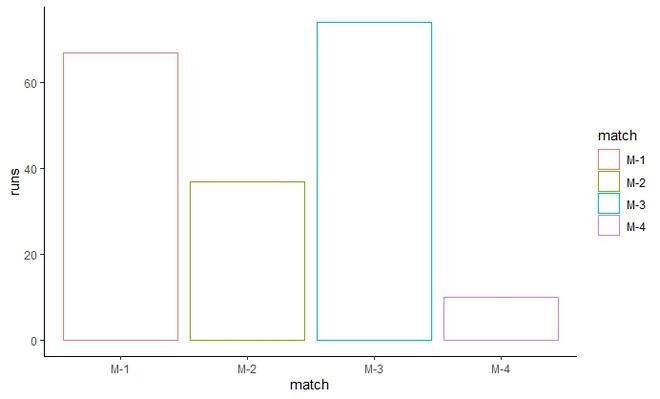
Here we need to provide different outlines. The fill will be the same which is white. The fill will be inside the geom_bar( ). The color will be inside aes( ) under ggplot( ) as it is variable in this case.
Example:
R
library(ggplot2)
ODI <- data.frame(match=c("M-1","M-2","M-3","M-4"),
runs=c(67,37,74,10))
perf <-ggplot(data=ODI, aes(x=match, y=runs,color=match))+
geom_bar(stat="identity",fill="white")+
theme_classic()
perf
|
Output:
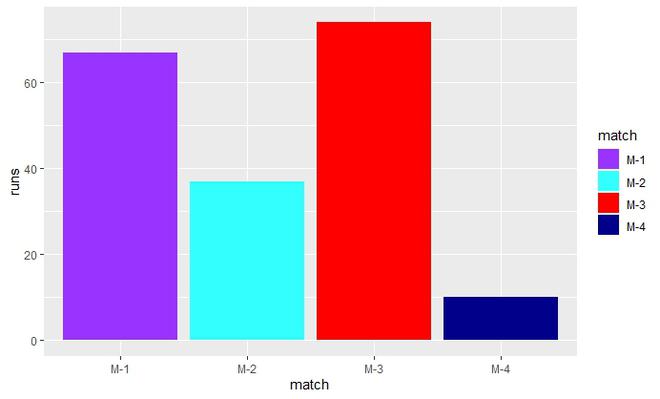
Method 2: Setting color manually
This function is used to provide custom colors. We can either write the color code as “#XXXXXX” or we can directly write the color name as “color_name”. The fill will be inside the ggplot2 as we need to manually assign different colors to the bars. Invoke the function and manually insert a vector which consists of the color code or the color name. The length of the vector should be same as the number of bars.
Example:
R
library(ggplot2)
ODI <- data.frame(match=c("M-1","M-2","M-3","M-4"),
runs=c(67,37,74,10))
perf <-ggplot(data=ODI, aes(x=match, y=runs,fill=match))+
geom_bar(stat="identity")+
scale_fill_manual(values=c("#9933FF",
"#33FFFF",
"red",
"darkblue"))
perf
|
Output:
Similarly, we can set outlines color manually. Just replace the keyword fill everywhere to color in the above code. The function will now become : scale_color_manual( )
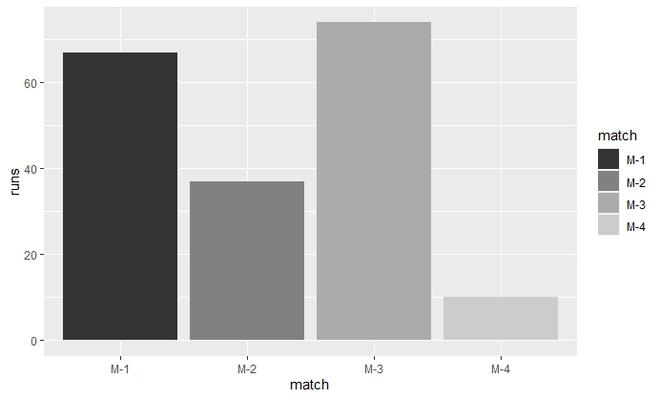
The function used here is scale_fill_grey( ). The fill is inside the aes( ) as we need different gray scale colors. Invoke the function scale_fill_grey( ) at last.
Example:
R
library(ggplot2)
ODI <- data.frame(match=c("M-1","M-2","M-3","M-4"),
runs=c(67,37,74,10))
perf <-ggplot(data=ODI, aes(x=match, y=runs,fill=match))+
geom_bar(stat="identity")+
scale_fill_grey()
perf
|
Output:
Share your thoughts in the comments
Please Login to comment...