Feature Importance with Random Forests
Last Updated :
05 Apr, 2024
Features in machine learning, plays a significant role in model accuracy. Exploring feature importance in Random Forests enhances model performance and efficiency.
What is Feature Importance?
Features in machine learning, also known as variables or attributes, are individual measurable properties or characteristics of the phenomena being observed. They serve as the input to the model, and their quality and quantity can greatly influence the accuracy and efficiency of the model. There are three primary categories of features:
- Numerical Features: These features represent quantitative data, expressed as numerical values (integers or decimals). Examples include temperature (°C), weight (kg), and age (years).
- Categorical Features: These features represent qualitative data, signifying the category to which a data point belongs. Examples include hair color (blonde, brunette, black) and customer satisfaction (satisfied, neutral, dissatisfied).
- Ordinal Features: These features are a subtype of categorical features, possessing an inherent order or ranking. Examples include movie ratings (1 star, 2 stars, etc.) and customer service experience (poor, average, excellent).
Why Feature Importance Matters?
Understanding feature importance offers several advantages:
- Enhanced Model Performance: By identifying the most influential features, you can prioritize them during model training, leading to more accurate predictions.
- Faster Training Times: Focusing on the most relevant features streamlines the training process, saving valuable time and computational resources.
- Reduced Overfitting: Overfitting occurs when a model memorizes the training data instead of learning general patterns. By focusing on important features, you can prevent the model from becoming overly reliant on specific data points.
Feature Importance in Random Forests
Random Forests, a popular ensemble learning technique, are known for their efficiency and interpretability. They work by building numerous decision trees during training, and the final prediction is the average of the individual tree predictions.
Several techniques can be employed to calculate feature importance in Random Forests, each offering unique insights:
- Built-in Feature Importance: This method utilizes the model’s internal calculations to measure feature importance, such as Gini importance and mean decrease in accuracy. Essentially, this method measures how much the impurity (or randomness) within a node of a decision tree decreases when a specific feature is used to split the data.
- Permutation feature importance: Permutation importance assesses the significance of each feature independently. By evaluating the impact of individual feature permutations on predictions, it calculates importance.
- SHAP (SHapley Additive exPlanations) Values: SHAP values delve deeper by explaining the contribution of each feature to individual predictions. This method offers a comprehensive understanding of feature importance across various data points.
Feature Importance in Random Forests: Implementation
To show implementation, The iris dataset is used throughout the article to understand the implementation of feature importance.
Prerequisities: Install necessary libraries
!pip install shap
Python3
from sklearn.datasets import load_iris
from sklearn.ensemble import RandomForestClassifier
from sklearn.model_selection import train_test_split
import pandas as pd
import shap
from sklearn.metrics import accuracy_score
import numpy as np

iris = load_iris()
X = iris.data
y = iris.target
feature_names = iris.feature_names

X_train, X_test, y_train, y_test = train_test_split( X, y, test_size = 0.25, random_state=42) # Split dataset into 75% train and 25% test
clf = RandomForestClassifier(n_estimators=100, random_state=42)
clf.fit(X_train, y_train)
Method 1: Built-in feature importance with Scikit Learn
Gini Importance: The importance of a feature is computed as the (normalized) total reduction of the criterion brought by that feature. The criterion is the Gini impurity, which measures the impurity of a node in a decision tree, with more substantial weight to the most important features. Therefore, Gini importance is also known as the total decrease in node impurity.
Gini Importance extends this concept to evaluate the contribution of each feature across multiple trees. When building a Random Forest, the algorithm constructs an ensemble of decision trees by repeatedly sampling the dataset and creating diverse subsets. For each tree, Gini Importance quantifies the reduction in Gini impurity achieved by splitting nodes based on a particular feature. Features that consistently lead to greater impurity reduction across the ensemble are assigned higher Gini Importance scores.
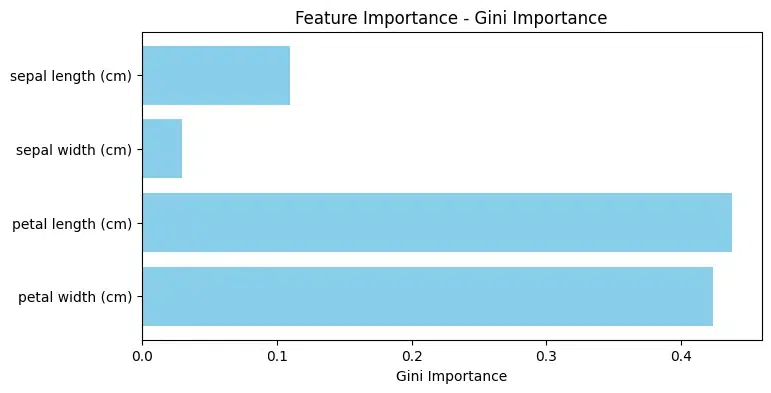
The implementation code below calculates and displays the Gini Importance of features in a machine learning model (clf).
Python3
# Built-in feature importance (Gini Importance)
importances = clf.feature_importances_
feature_imp_df = pd.DataFrame({'Feature': feature_names, 'Gini Importance': importances}).sort_values('Gini Importance', ascending=False)
print(feature_imp_df)
Output:
             Feature  Gini Importance
2  petal length (cm)         0.437635
3   petal width (cm)         0.423137
0  sepal length (cm)         0.109683
1   sepal width (cm)         0.029545
Visualization plot for feature importance
Python3
# Create a bar plot for feature importance
plt.figure(figsize=(8, 4))
plt.barh(feature_names, importances, color='skyblue')
plt.xlabel('Gini Importance')
plt.title('Feature Importance - Gini Importance')
plt.gca().invert_yaxis()  # Invert y-axis for better visualization
plt.show()
Output:
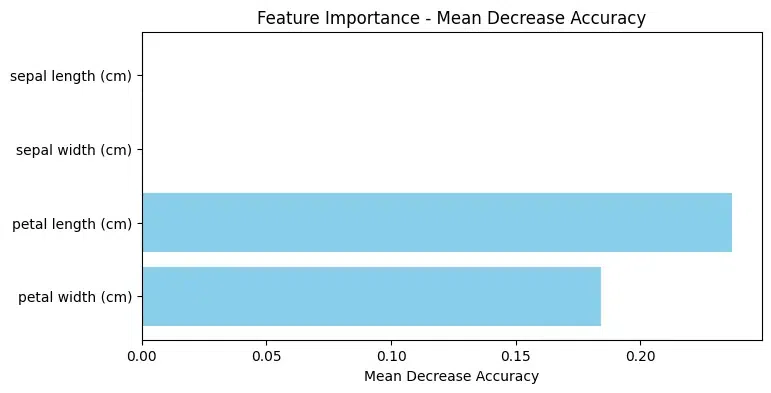
Mean Decrease Accuracy: In the Mean Decrease Accuracy (MDA) measures the average reduction in model accuracy across all out-of-bag cross-validated predictions when a particular feature undergoes permutation after training but before making predictions.
It offers a comprehensive evaluation of a feature’s significance in influencing the model’s performance. MDA inherently adopts a global perspective, taking into account the entire dataset to gauge the importance of individual features.
- The code Iterates through each feature in the dataset. For each feature, it creates a copy of the test set and shuffles the values of that specific feature.
- Calculating the accuracy of the classifier on the modified test set and comparing the shuffled accuracy with the initial accuracy to determine the decrease in accuracy caused by shuffling that specific feature.
Python3
# Mean Decrease Accuracy
importances = []
initial_accuracy = accuracy_score(y_test, clf.predict(X_test)) # initial accuracy
for i in range(X.shape[1]):
    X_test_copy = X_test.copy()
    np.random.shuffle(X_test_copy[:, i])
    shuff_accuracy = accuracy_score(y_test, clf.predict(X_test_copy))
    importances.append(initial_accuracy - shuff_accuracy)

accuracy_df = pd.DataFrame({'Feature': feature_names, 'Decrease in Accuracy': importances}).sort_values('Decrease in Accuracy', ascending=False)
print(accuracy_df)
Output:
             Feature  Decrease in Accuracy
2  petal length (cm)              0.263158
3   petal width (cm)              0.157895
0  sepal length (cm)              0.000000
1   sepal width (cm)              0.000000
Visualization plot for feature importance
Python3
# Create a bar plot for feature importance
plt.figure(figsize=(8, 4))
plt.barh(feature_names, importances, color='skyblue')
plt.xlabel('Mean Decrease Accuracy')
plt.title('Feature Importance - Mean Decrease Accuracy')
plt.gca().invert_yaxis()
plt.show()
Output:
Method 2: Permutation feature importance
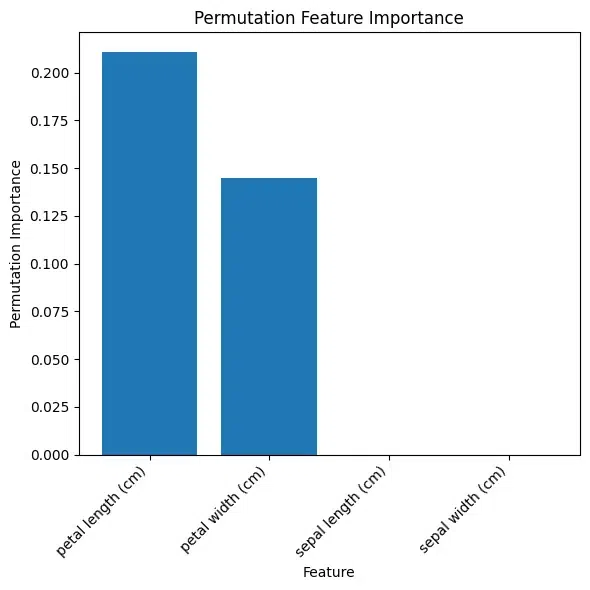
Permutation importance assesses the significance of each feature independently in out-of-bag cross-validated predictions, providing a more reliable and robust measure.
By evaluating the impact of individual feature permutations on predictions, it calculates importance. This method involves randomly shuffling a single feature’s values and measuring the resulting performance decrease (e.g., accuracy, F1-score). Comparing the model’s original and permuted values allows for a precise evaluation of feature importance.
The code uses the permutation_importance function to calculate permutation feature importance for each feature in a trained classifier, where:
- n_repeats: Specifies how many times each feature is permuted to calculate the importance.
- n_jobs: Determines the number of parallel jobs to run. Setting it to -1 utilizes all available CPU cores, improving computation speed.
Python3
# Permutation feature importance
from sklearn.inspection import permutation_importance
result = permutation_importance(clf, X_test, y_test, n_repeats=10, random_state=0, n_jobs=-1)
perm_imp_df = pd.DataFrame({'Feature': feature_names, 'Permutation Importance': result.importances_mean}).sort_values('Permutation Importance', ascending=False)
print(perm_imp_df)
Output:
             Feature  Permutation Importance
2  petal length (cm)                0.210526
3   petal width (cm)                0.144737
0  sepal length (cm)                0.000000
1   sepal width (cm)                0.000000
Here’s what the permutation importance values suggest in this output:
- “Petal length (cm)” has the highest permutation importance value (0.210526), indicating that shuffling the values of this feature leads to a significant decrease in the model’s performance.
- “Petal width (cm)” also has a relatively high permutation importance value (0.144737), though lower than “Petal length (cm)”.
- “Sepal length (cm)” and “Sepal width (cm)” have permutation importance values of 0, suggesting that shuffling the values of these features does not affect the model’s performance significantly.
Visualization plot for feature importance
Python3
plt.figure(figsize=(6, 6))
plt.bar(perm_imp_df['Feature'], perm_imp_df['Permutation Importance'])
plt.xlabel('Feature')
plt.ylabel('Permutation Importance')
plt.title('Permutation Feature Importance')
plt.xticks(rotation=45, ha='right')  # Adjust rotation for better visibility
plt.tight_layout()
plt.show()
Output:
Method 3: SHAP values
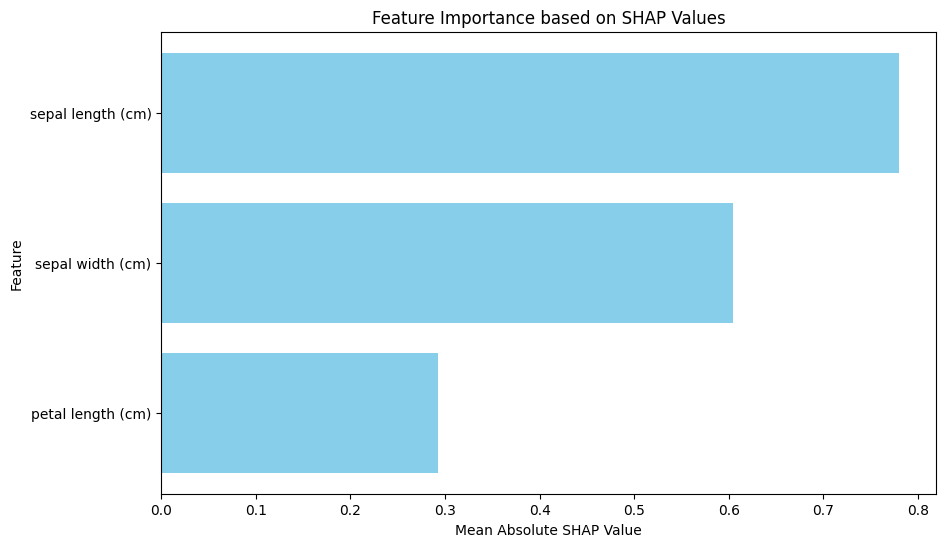
SHAP (SHapley Additive exPlanations) value is a measure of the contribution of a feature towards the prediction for each instance.
- For a given prediction made by a Random Forest model, SHAP values can be calculated for each feature for that specific instance.
- It involves considering all possible subsets of features and their interactions, measuring the impact of including or excluding each feature on the prediction.
Positive SHAP values indicate a positive contribution to the prediction, while negative values suggest a negative contribution. The magnitude of the SHAP value represents the strength of the contribution.
Python3
shap_summary = np.abs(shap_values).mean(axis=0)
shap_summary_df = pd.DataFrame({'Feature': feature_names[:-1], 'SHAP values': shap_summary})
shap_summary_df = shap_summary_df.sort_values('SHAP values', ascending=False)
print(shap_summary_df)

# Visualization
plt.figure(figsize=(10, 6))
plt.barh(shap_summary_df['Feature'], shap_summary_df['SHAP values'], color='skyblue')
plt.xlabel('Mean Absolute SHAP Value')
plt.ylabel('Feature')
plt.title('Feature Importance based on SHAP Values')
plt.gca().invert_yaxis()
plt.show()
Output:
             Feature  SHAP values
0  sepal length (cm)     0.780402
1   sepal width (cm)     0.604297
2  petal length (cm)     0.292078
Shap Values
Conclusion
In summary, the importance of features in Random Forest models reveals how each feature contributes to the accuracy of the model. Features that are ranked highly have a significant influence on the model’s decision-making, improving its performance.
Share your thoughts in the comments
Please Login to comment...