How to Monitor System Activity in linux | top Command
Last Updated :
11 Dec, 2023
top command is used to show the Linux processes. It provides a dynamic real-time view of the running system. Usually, this command shows the summary information of the system and the list of processes or threads which are currently managed by the Linux Kernel. As soon as you will run this command it will open an interactive command mode where the top half portion will contain the statistics of processes and resource usage. And Lower half contains a list of the currently running processes. Pressing q will simply exit the command mode.
How to Monitor System Activity in Linux Using `top` Command
One of the strengths of the top command is its ability to dynamically update the displayed information at regular intervals. This real-time monitoring capability enables users to observe changes in system activity, identify spikes in resource usage, and quickly respond to performance issues.
To launch the top command, open a terminal window and simply type:
top
This will display a continuously updating screen showing various system metrics. By default, processes are sorted by CPU usage in descending order, with the most resource-intensive processes listed at the top.

Monitor system activity in linux using top command
Here,
- PID: Shows task’s unique process id.
- PR: The process’s priority. The lower the number, the higher the priority.
- VIRT: Total virtual memory used by the task.
- USER: User name of owner of task.
- %CPU: Represents the CPU usage.
- TIME+: CPU Time, the same as ‘TIME’, but reflecting more granularity through hundredths of a second.
- SHR: Represents the Shared Memory size (kb) used by a task.
- NI: Represents a Nice Value of task. A Negative nice value implies higher priority, and positive Nice value means lower priority.
- %MEM: Shows the Memory usage of task.
- RES: How much physical RAM the process is using, measured in kilobytes.
- COMMAND: The name of the command that started the process.
Examples on How to monitor system activity in Linux Using `top` Command
1) Exit Top Command After Specific repetition:
Top output keep refreshing until you press ‘q‘. With below command top command will automatically exit after 10 number of repetition.
top -n 10
2) Display Specific User Process
top -u paras
3) Highlight Running Process in Top: Press ‘z‘ option in running top command will display running process in color which may help you to identified running process easily
4) Shows Absolute Path of Processes: Press ‘c‘ option in running top command, it will display absolute path of running pro
5) Kill running process: You can kill a process after finding PID of process by pressing ‘k‘ option in running top command without exiting from top window as shown below.
6) Sort by CPU Utilisation: Press (Shift+P) to sort processes as per CPU utilization.
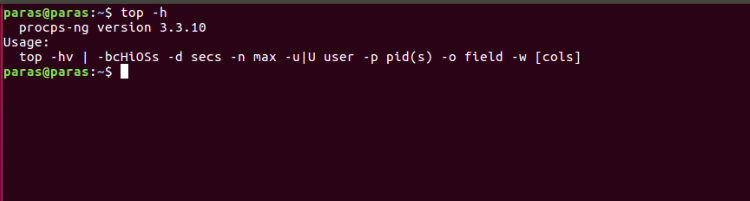
7) Shows top command syntax:
top -h
 8) Batch Mode : Send output from top to file or any other programs.
top -b
9) Secure Mode : Use top in Secure mode.
top -s
10) Command Line : The below command starts top with last closed state.
Top -c
11) Delay time : It tells delay time between screen updates.
Top -d seconds.tenths
Frequenlty Asked Question
1) What is the top command in Linux, and how does it help monitor system activity?
The `top` command is a built-in utility in Linux that provides a real-time, dynamic view of the system’s performance. It displays information about CPU usage, memory usage, running processes, and more, allowing users to monitor and analyze system activity effectively.
2) How do I interpret the information displayed by the top command?
The information displayed by the `top` command includes columns such as PID, %CPU, %MEM, VIRT, RES, and COMMAND. PID is the process ID, %CPU represents CPU usage, %MEM shows memory usage, VIRT is virtual memory, RES is physical RAM usage, and COMMAND displays the name of the process.
3) Can I customize the display of the top command to focus on specific processes or users?
Yes, the `top` command is highly customizable. Users can press keys to toggle between different views, sort processes based on various criteria, and filter the display to show processes for a specific user. For example, pressing ‘u’ allows filtering by username.
4) How can I use the top command to identify and terminate resource-hungry processes?
The `top` command allows users to interactively manage processes. Pressing ‘k’ enables the user to kill a specific process by entering its PID. Sorting processes by CPU or memory usage (with ‘P’ or ‘M’) helps identify resource-intensive tasks that may need attention.
5) Are there additional advanced features of the top command beyond real-time monitoring?
Yes, the `top` command offers advanced features. Users can run `top` with specific options, such as ‘-n’ to exit after a specific number of repetitions, ‘-u’ to display processes for a specific user, ‘-b’ for batch mode (useful for scripting), and ‘-d’ to set the delay time between screen updates. Understanding these options enhances the utility of the `top` command in diverse scenarios.
Conclusion
In this article we discussed the top command which is an essential tool for Linux users and system administrators, offering real-time insights into system processes and resource usage. Its dynamic interface, interactive commands, and customization options make it a powerful tool for monitoring and troubleshooting. From sorting processes and killing tasks to specific user monitoring, the top command provides a concise yet comprehensive view of system health, enabling users to maintain optimal performance efficiently.
Share your thoughts in the comments
Please Login to comment...