New Features of Microsoft Edge Developer Tools
Last Updated :
16 Nov, 2023
In Edge, you get some tools that can be used for debugging web pages. These tools are Development tools that allow you to inspect the code, check network requests, improve performance, etc. There are many changes made to the DevTools of Edge in its subsequent version in 2023. From UI changes to added functionality there are many good changes made to some tools.
The various changes made to DevTools are:
New buttons and icons have been added to the DevTools user interface. For example, the current frame in the call stack is shown by a blue arrow pointing right while debugging using the Sources tool. The debugging icons in Microsoft Visual Studio and Microsoft Visual Studio Code are more matched with this icon.

New icons and buttons
Correct screen reader announce dropdown announces
Screen readers mispronounced dropdown menus as “expanded” when they were in Device Mode. The moment these menus truly crumbled. Within Microsoft Edge Now that this problem has been resolved, screen readers appropriately identify dropdown menus in Device Mode as “collapsed” or “expanded”

Correct screen reader announces dropdown state
The V8 JavaScript engine periodically samples all the JavaScript functions that are executing while a profile is recorded in the Performance tool. This allows the engine to precisely report CPU time in the flame chart. These samples are time-consuming to gather when evaluating a website with a large number of cross-domain frames. Due to the substantial cost caused by this, the main thread becomes slower, which lowers the website’s performance during profiling. V8 gathers these samples more effectively, which improves site performance during the profiling process.

Profiling changes in the Performance tool
The performance tool’s Selector Stats function. Performance tool users can identify which CSS selectors are causing slow performance by using the Selector Stats data to determine which selectors take the longest to recalculate style.

Selector Stats
DevTools can now recognize and notify users of CSS attributes (such as moving text) that, when used in web page animation, may cause performance issues with Layout. Layout is the process by which a web browser redoes the positions and forms of elements in a page in order to render all or part of it afresh. We recommend that you minimize Layout as it is a user-blocking operation in the browser and will keep your site content fluid and responsive to user input.

Styles pane alert
More than 1 GB of enhanced traces can be loaded using the Memory
The dev tools More than 1 GB of improved traces could not be loaded. We’ve resolved this issue. Improved traces of any size can now be loaded with success. Microsoft Edge has an experimental feature called “Enhanced Traces” that lets you export and import full DevTools instances with as much state as possible retained across the Memory, Performance, Elements, Console, and Sources tools. These files are stored as devtools files. Here are some references to source code DOM snapshots, Heap snapshots, Performance profiles, and Console messages.

More than 1 GB of enhanced traces
If you are using Allocation instrumentation on the timeline in the memory tool then it might look like your web content is lagging. The new feature allows the sample rate for the heap to be scaled to the time for generation of the tool.

Memory tool timing changes
Accessibility Improvements for the CSS Overview
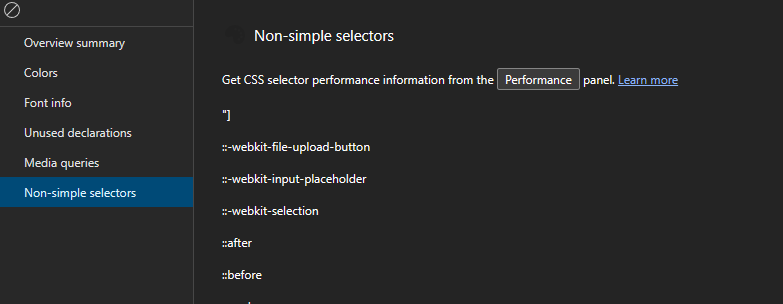
In the CSS Overview tool you get a section of non-simple selectors when taking an overview snapshot of a webpage’s CSS. In that section now it’s easier to use with accessibility technology, such as screen readers.

Accessibility improvements for the CSS Overview tool
Conclusion
The Microsoft Edge Developer Tools are always being updated to provide developers with the necessary features. These tools provide a full suite for web development, including sophisticated debugging capabilities and responsive design testing. It is advisable to review the most recent documentation to see whether there have been any additions or improvements.
Share your thoughts in the comments
Please Login to comment...