Coverage Tool in Microsoft Edge Browser
Last Updated :
31 Oct, 2023
The Coverage Tool is a very basic tool that displays various files requested by the webpage to the server. It provides various information about the file such as URL, type, total bytes, and unused bytes. The tool is mostly used to find out the JS and CSS code that is not being used by the site. This information is very important to remove unwanted or unused code that takes a lot of memory which helps the developers to speed up the web page loading and performance.
The various benefits of the Coverage Tool are:
- Details viewed in a Table: You get a tabular view of various origins from where the files are being downloaded. The view has columns that are URL, type, total bytes, and unused bytes that provide the necessary information to the developers.
- Inspect individual file size: You get the idea about the file size that each JS or CSS file is taking up in memory. You also get the unused size, which helps the developers improve performance by removing the unused code.
- List all JS and CSS files: You get a list of all JS and CSS files with the respective URL. This helps the developer get an idea of all the files requested by the web page so, they can remove the unknown or unwanted files.
- Usage Bar: You also get a visual bar under the Usage Visualization column with red and blue colors representing the used and unused bytes, respectively. This saves time in finding the unused code, as the developer can just get the required information at a glance.
The Coverage Tool is present in DevTools in the Edge browser. To open it, follow these steps:
Step 1: Right-click on the web page and then press Inspect to open DevTools.
Step 2: In the DevTools, press the add button present at the end of the tabs at the top of the DevTools. A list of tools will pop up, and from the list select Coverage.

Opening Coverage Tool
The various columns in the tool are:

Columns in the Coverage Tool
- URL: The origin of the JS or CSS file.
- Type: Mention the file type, either CSS or JS.
- Total Bytes: Mention the total size of the file in bytes.
- Unused Bytes: Mention the unused code size in bytes.
- Usage Visualization: Shows a bar representing the used code and the unused code in red and blue, respectively.
The various options present in the tool are:

Options in the Coverage Tool
- Choose Coverage Granularity: You can choose the level of data displayed by selecting Per block or Per function. Per block measures, each line of code, and Per function measures the method of the code. Per block has significant overhead in the user’s system.
- Refresh: Click it to reload the requested files.
- Clear All: Click it to clear all the lists of files and the data from the tool.
- Export: Click it to export the coverage data in JSON format.
- URL filter: Search text in the listed URL.
- Coverage Type: Filter the listed file on the basis of JS or CSS file type.
- Content scripts: Check it to also display the file requests of extensions having context to the web page.
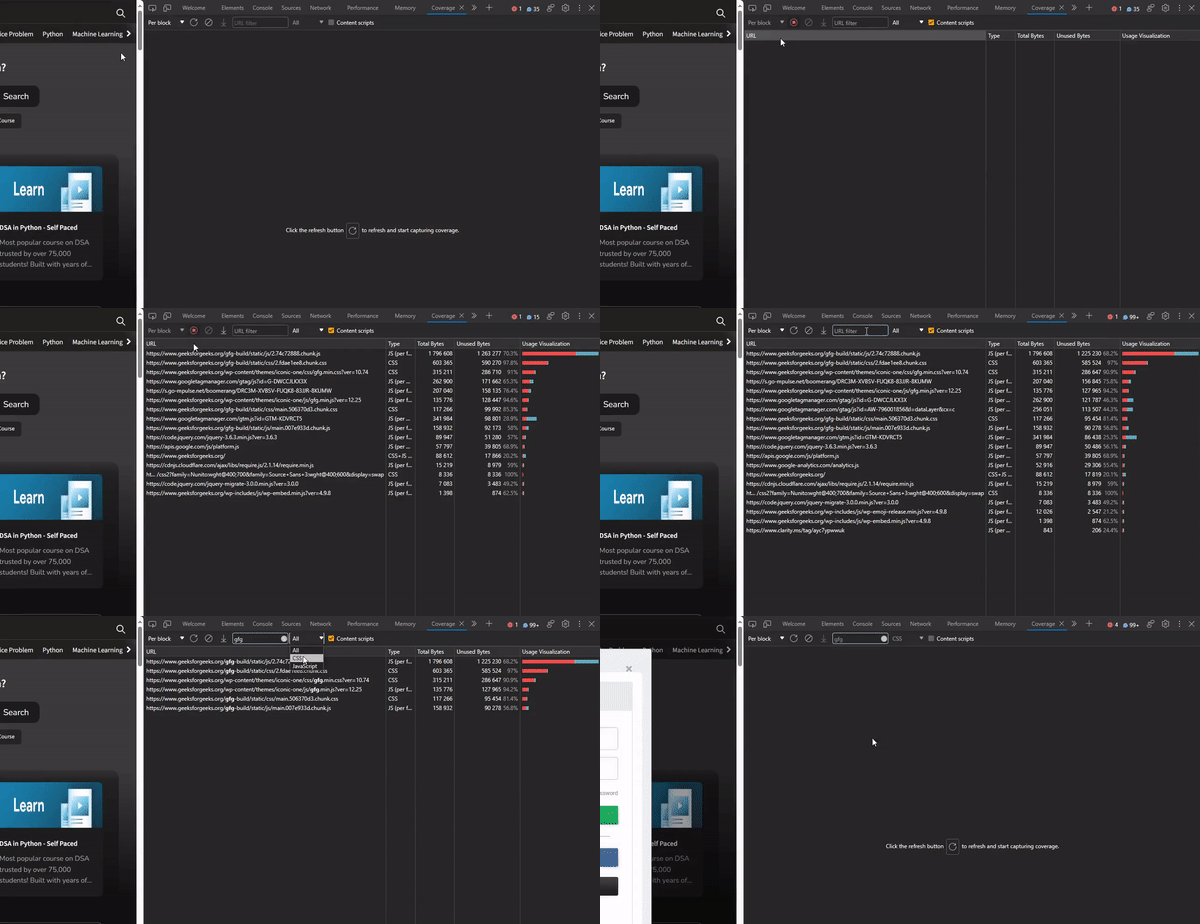
As an example, let’s use the Coverage tool on the GFG web page to list out all the various files and filter out the information.
Step 1: While on the GFG web page, open the Coverage tool by following the above steps.
Step 2: Press the refresh button in the tool to list out the files. Filter the list of files with respect to a string or on the basis of the file type.

Using the Coverage tool on the GFG web page
Conclusion:
The web page required a lot of resources, which it requested from various origins, and among them were JS and CSS code. These codes can take up a lot of memory, and some of them may not be used at all, so Edge provides a Coverage tool to list out all these codes along with the respective URL and the unused bytes, which helps a lot to improve the performance of the web page.
Share your thoughts in the comments
Please Login to comment...