Developer Resources Tool in Microsoft Edge Browser
Last Updated :
21 Mar, 2024
The Developer Resources Tool is used to view the various URLs of resources used by the developers on a website. This is a very useful tool for developers to view the various resources used in the site to inspect or better optimize the loading time of the site. You can view the status, URL, Initiator, Total Bytes, and Error information of the resources.
Benefits of Developer Resources Tool
The various benefits of the Developer Resources Tool are:
- View Resources URLs: The tool views all the URLs of the resources used by the developer for the site. This URL confirms the origin of the resources and confirms that the sites do not use unknown resources.
- Tabular Format: The resource information is presented in a tabular format that allows searching and sorting facility. The table consists of status, URL, Initiator, Total Bytes, and Error columns.
- Error status: The resource request status of success or failure is also displayed in the tool and under the error column you get the reason for the failure status of the particular resource. You can view the errors and fix the reason for the resource request being unsuccessful.
How to Open Developer Resources Tool in Edge Browser?
The Developer Resources Tool is a part of DevTools in Edge and to open it follow these steps:
Step 1: In Edge visit the web page where you want to use this tool. Right-click on the page and select “Inspect,” or press Ctrl+Shift+I or F12 on your keyboard to open the Developer Tools.
Step 2: In the Developers Tools click the add button then navigate to More tools > Developer Resources from the dropdown menu.
Opening Developer Resources Tool
Understanding Developer Resources Tool in Edge
The tool provides various information of the resources in a tabular format and options to search and load through website.
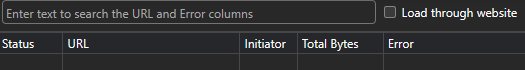
Various options in Developer Resources Tool
- Search bar: Used to search through URL and Error column for specific text.
- Load Through website: If checked then the HTTPS developer resources are loaded through website instead of DevTools. Check this if you want the original resources information without any DevTools changes interfering.
- Table: The table displays the list of developer resources used by the site.
- Status: This column displays the request status of the resources. Displays success if request is succeeded and failure if request does not succeed.
- URL: This column displays the URL or the resources.
- Initiator: This column displays the file calling requesting the resources.
- Total Bytes: This column displays the size of the requested resources in bytes.
- Error: This column is blank for resources with success status but displays the reason if status of resources is failure.
Showing usage of Developer Resources Tool
Lets visit GFG site and check its various resources requests.
Step 1: Using Edge visit GFG site and open DevTools and open Developer Resources Tool as mentioned in the article.
Step 2: Refresh the page and let the Developer Resources Tool load the various resources requested by the site.
Using Developer Resources Tool
Conclusion
Many browsers uses various resources for added functionality or styling but it can be hard to track all of them. The Developer Resources tool view all these request for resources in a tabular format which is very useful for inspection and take appropriate action to remove unused resources request or make optimization.
Share your thoughts in the comments
Please Login to comment...