New Features of Web Inspector in Safari
Last Updated :
27 Feb, 2024
Web Inspector plays a pivotal role in streamlining the web development process within the Safari browser. It’s a suite of powerful tools enabling developers to analyze, debug, and optimize their web pages seamlessly. With continuing updates, Web Inspector becomes even more robust and sophisticated, empowering developers to achieve exceptional web experiences.
Let’s explore some of the new additions and enhancements that have been made to Safari’s Web Inspector.
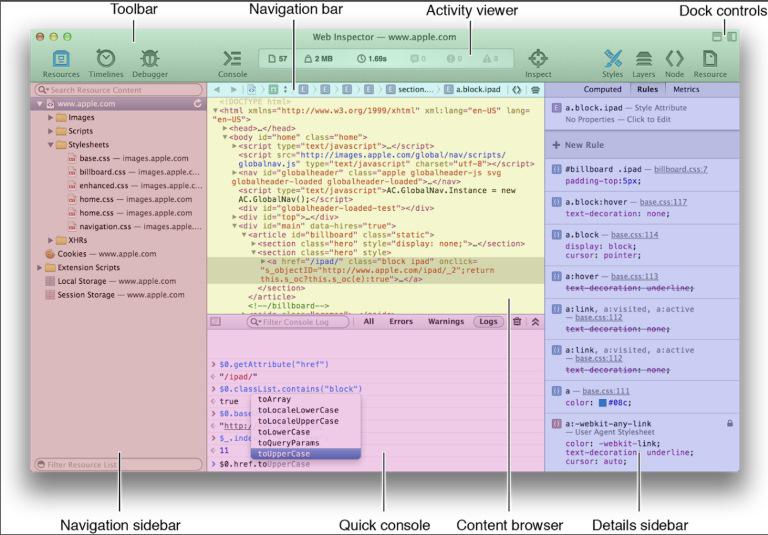
Safari Web Inspector
New Features of Web Inspector in Safari
1. Typography Inspection and Variable Font Editing
- Precision Typography: Web Inspector now offers deeper insights into font properties and features. The revamped Font panel in the details sidebar of the Elements tab unveils crucial information like the primary font used, potential fallback fonts, font size, weight, style, stretch variations, and more. You gain an intricate understanding of your web page’s typography.
- Variable Font Control: The ability to directly edit variable fonts is a game-changer. Variable fonts allow for fine-grained adjustments within a single font file. Experiment with different variations and witness the impact on your web design in real time – a boon for creative and nuanced typographic expression.
2. Emulating User Preferences
- Catering to Accessibility: A dedicated section for User Preference Overrides within the Elements tab puts accessibility testing at the forefront. Simulate various user preferences such as reduced motion, increased contrast, preferred color scheme (dark/light mode), and more. This empowers you to optimize your site for inclusivity and ensure a seamless experience for users with different needs.
3. Streamlined Debugging with Enhancements
- Element Badges: DOM node trees are now augmented with informative badges. Quickly spot elements using CSS Grid or Flexbox, elements with associated JavaScript breakpoints, and more. This visual guidance simplifies debugging and accelerates your workflow.
- Symbolic Breakpoints: These potent breakpoints can target specific functions or lines of code, even within minified JavaScript files. Symbolic breakpoints provide a laser-focused method of pausing your code execution and inspecting values for deeper error analysis.
4. Responsive Design Mode Refresh
- Beyond Resolution Testing: Safari’s Responsive Design Mode continues to mature, enabling you to simulate a vast array of device sizes and orientations. Tailor your interface across the device landscape with ease and precision.
- Device-Specific Simulation: Go deeper by emulating device-specific features, offering insights into how your website renders and functions on real-world devices.
5. Additional Refinements to Existing Features
- Enhanced CSS Grid Inspection: CSS Grid overlays, available in previous versions, provide a clear visual representation of grid layouts. You can interact with overlays to modify row and column sizes, alignment properties, etc., enhancing CSS Grid development ease and precision.
- Improved Resource Inspection: Analyze detailed resource headers, preview responses, and troubleshoot network requests with even greater efficiency.
Steps to Open the Safari Web Inspector Tool
Here are the steps to make the most of Safari’s development tools:
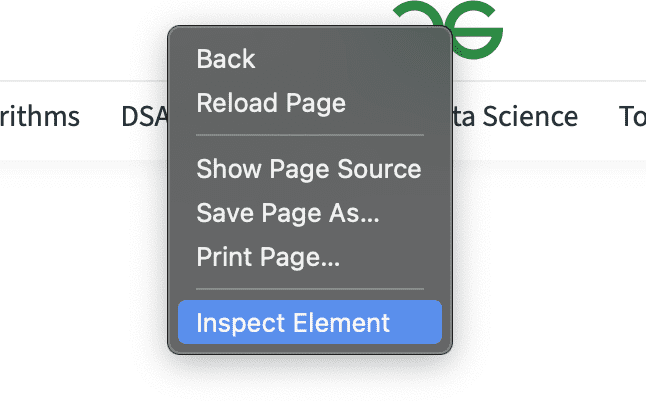
Step 1: Open the web monitor, Right-click your web browser and select “Inspect Element”, or press Option + Command + I .
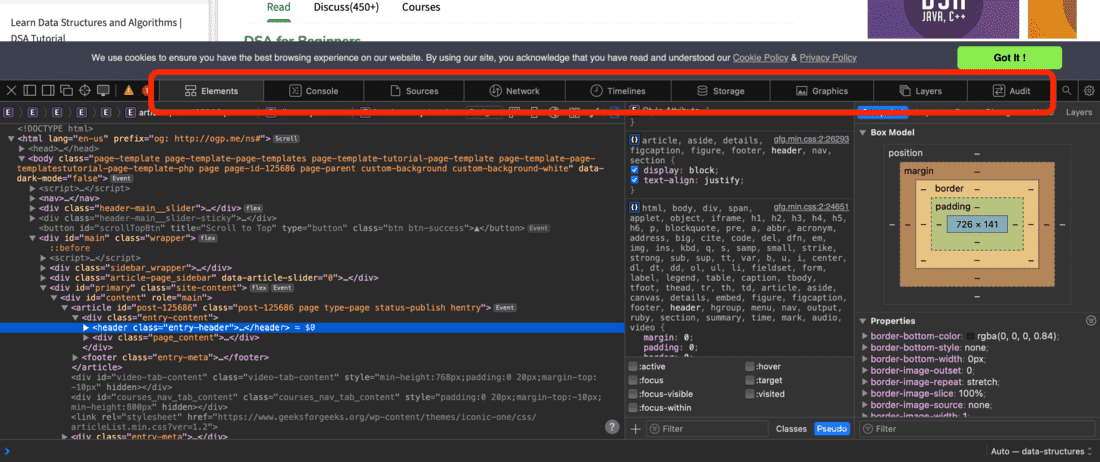
Step 2: Explore the various tabs in the Web Inspector, such as Elements, Console, Sources, Network, and so on.
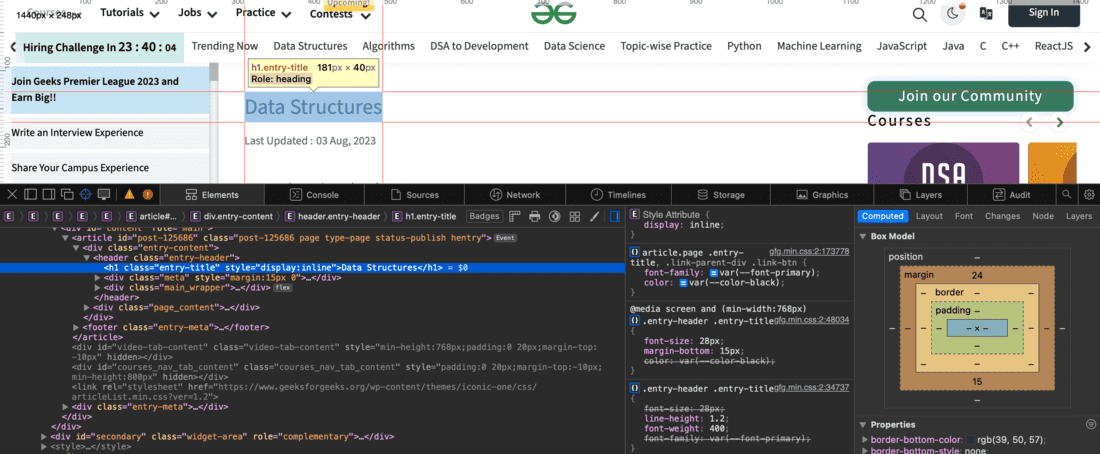
 Step 3: Review the HTML Items: Click the Elements tab to view the HTML elements and view their styles.
Step 4: Go to the Sources tab to set breakpoints, debug JavaScript code, and understand how to call functions.
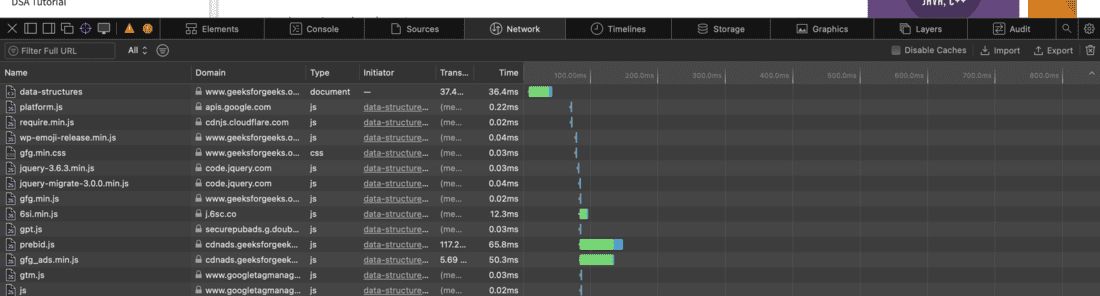
Step 5: Check network activity,On the Network tab, you can see what’s happening with network requests, view request headers, and manage response data.
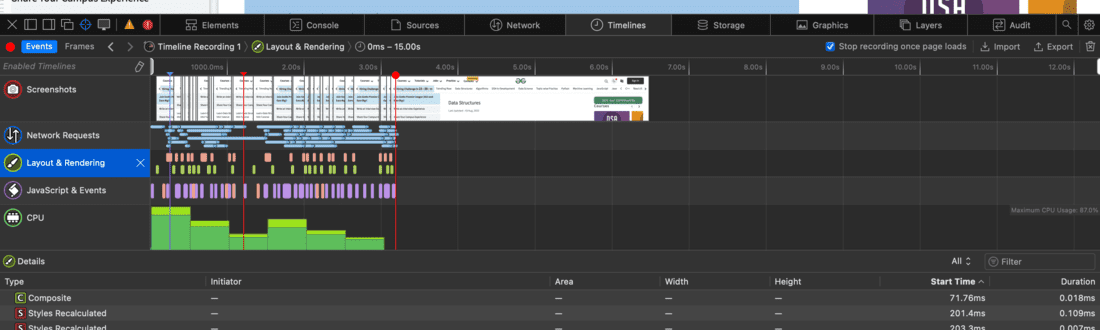
Step 6: Improve Performance, Use the Performance and Timeline tabs to analyze and speed up your web application.
The Path to Web Development Excellence
Safari’s evolving Web Inspector solidifies its position as a cornerstone for web development success. The new additions streamline inspection, debugging, and optimization, empowering you to craft exceptional, accessible, and visually stunning websites. By using the Web Inspector, you can elevate your development prowess and deliver experiences that captivate and resonate with your audience.
Important Notes to Consider:
- These new features may be found in the latest iterations of Safari and the WebKit engine.
- Consider specifying the Safari and/or WebKit versions the features were introduced in for added clarity.
Conclusion
Safari is making its Web Inspector tool even better! These new changes help developers make websites look beautiful, work smoothly, and be easy to use for everyone. The focus on fonts, debugging problems, and making sites work on different devices is a big win. As Safari keeps improving, we can expect websites to become even more awesome!
Share your thoughts in the comments
Please Login to comment...