Network Tool in Microsoft Edge Browser
Last Updated :
16 Oct, 2023
The Network Tool is used to view the various network request and corresponding responses of the web page. It provides various types of information about the request such as hearde, payload and initiator. You are also allowed to set various network conditions or filter in the requests or set network throttling.
Features of Network Tool
The various features of the Network Tool are:
- Various filtering options: You can filter the network requests and responses on the basis of the resource type or search the respective file in the filter bar. This will help you to check certain resources request that you want.
- Inspecting particular range: In the timeline of the tool you can select a range where the network activity that you want can be focused. This helps in inspecting particular request at a give time.
- Various network related information: The network tool provides various information about the selected resource. The information includes the HTTP header, size, status, time etc.
Benefits of Network Tool
The various benefits of Network Tool are:
- Color coded bars: The various request and responses are color coded for the user to visualize. Each request bar is a combination of multiple colored bar displaying information such as initial connection, SSL and waiting for response.
- Simple and Easy to use UI: The UI is very simple and have very less learning curve. The various options and information its provide is directly accessible.
- Very Useful for Debugging: To check the various resources download speed in variety of network behaviour. You can simulate slow connection, disable cache or change the user agent to other browser.
How to open Network Tool in Edge?
The Network Tool is present in DevTools in Edge. To open it follow these steps:
- Step 1: Using Edge browser visit a web page. Right-click on the page and select “Inspect,” or alternatively, press Ctrl+Shift+I or F12 on your keyboard to open the Developer Tools.
- Step 2: In the DevTools click on the tab named “Network”. If you do not see the Network tab in the DevTools, select Network from the add button present at the end of main toolbar.
Opening Network Tool
UI of Network Tool
The UI of the Network Tool can be divided in three section which are options, timeline and network log section. Lets move from top down and understand each section.
UI of Network Tool
Options section
There are many filtering and network related option provided by the tool. Let’s move left to right and understand each of them.

Options in the Network Tool
- Record Network Log: To start recording the network activity click this button after it starts the button turn red indicating that you can click it to stop. Alternatively use “Ctrl+E” to start/stop the recording.
- Clear Network Log: Removes all the logs present in the below section.
- Filter: On clicking this button a pane appears. You can filter logs by typing text or regular expressions in the filter input. You can also select the specific file types to filter. The pane also provides checkboxed to invert the filtering, hide data URLs, hide extension URLs, display blocked requests, response cookies and display 3rd-party requests.
- Search: You can search the files using some text or regular expression.
- Preserve log: If checked then every time you refresh the page or navigate around the page the logs will remain.
- Disable cache: If checked then while the DevTools is open the browser will not use cache so you can check all possible network activity.
- Throttling: Used to simulate the various network speed such as Fast 3G, slow 3G or offline. You can also add custom profile.
- More network conditions: Provides a drawer tab to change caching, network throttling, user agent, accepted content-encodings.
- Import: You can use this button to import a HAR file containing network information to preview it in the network tool.
- Export: You can use this button to export the network information recorded by the tool for that web page in HAR file format.
- Settings: You can customize the network tool using this setting button. The setting pane provides check boxes for big request rows, group by frame, include pending request in HAR file, overview section and screenshots section.
Timeline section
The timeline section provides visual bars representing the request and response time. You can also focus on specific range in the timeline to check the request on specific time period.
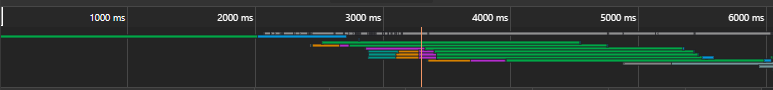
Timeline in Network Tool
Selecting a range in the Timeline
- To select a range in the timeline section bring you mouse to the starting point and then drag upto the area which you want to focus on.
- To resize it drag the white rectangle in the range.
- To get out of the range selection double click in the timeline section.
Selecting a range in Timeline
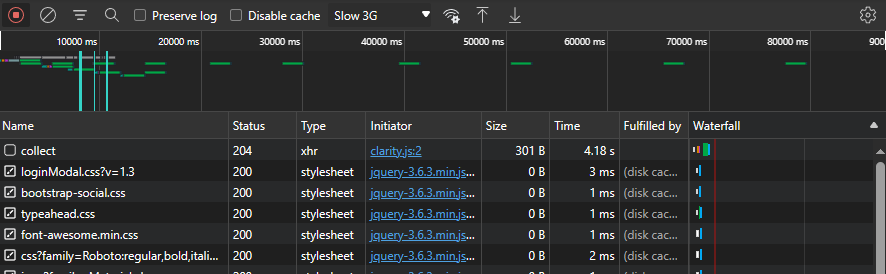
Network Log section
There are various information provided in the logs such as status, file type and size. The log also provide the waterfall graph to view it and get information about the durations.
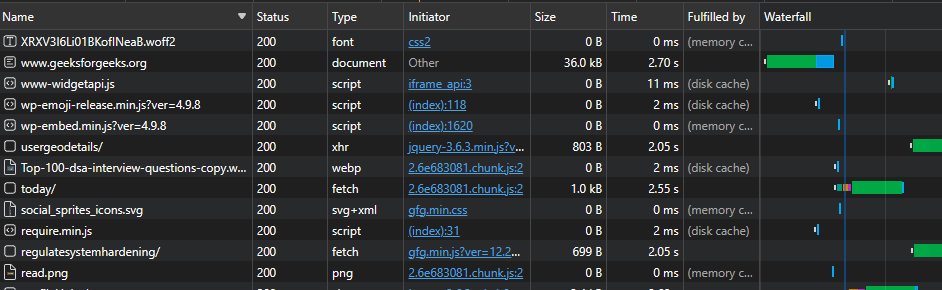
Details section in Network Tool
Add columns in the log
You can add more columns to provide additional information about a particular resources. Just right-click in any column and select the column you want and if you want response headers then select in it from the Response headers sub-menu.
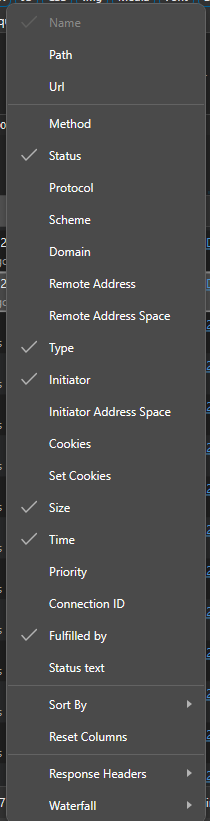
Various Columns provide for the Log
Display resources details
Click on the name of the resources to get various information about the HTTP header, contents, initiator and timing.
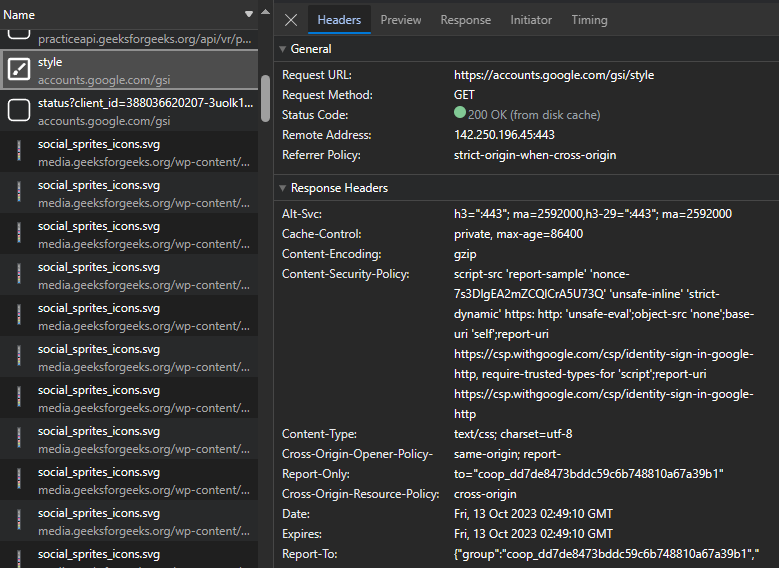
Resources Details
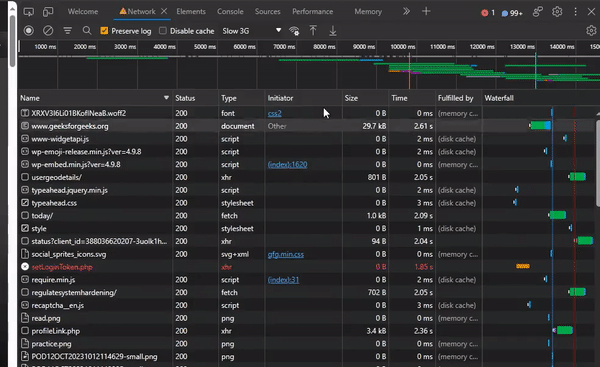
Using the Network Tool in Edge
Let’s use the network tool to inspect various resources of gfg tool.
Step 1: Visit the site and open the tool.
Step 2: Press on record and the log for the resources you want.
Step 3: Perform filtering or use using various options of the tool as you prefer.
Using the Network tool to inspect GFG site
Conclusion
The Network Tool is a very important tool for developers to check and simulated various network related activities. If the site is to be access by public then it must work as intended for various network speeds and user agents that the public uses.
Share your thoughts in the comments
Please Login to comment...