Rendering Tool in Microsoft Edge Browser
Last Updated :
18 Oct, 2023
The Rendering Tool provides various checkboxes and options to render the web page in different ways, which helps developers test the page for layout and design. You will also find various CSS options and various vision deficiencies that you can emulate using this tool.
Benefits of a Rendering Tool
The various benefits of the tool are:
- Improved experience for the visually impaired: The tools provide options to emulate visual deficiencies, which include blurred vision, reduced contrast, and color blindness. This helps a lot in checking and improving visual accessibility.
- Visualize the layout: You get enabled lines and colors for the layout shift region, layer borders, frames, etc. This helps a lot in visualizing and debugging the web page in terms of the layout.
- Rendering information: various rendering information, such as frame rate, GPU raster, and memory, can be displayed using this tool. The tool also provides core web vitals such as paint time, input delay, and layout shift.
- Emulate colors: You can emulate the color scheme, forced colors, preferred contrast, color gamut, etc. These options allow you to analyze the site for different types of users and check for accessibility.
- Live changes: Any options you change can be directly viewed on the web page. If you emulate the color changes, then the web page colors will change without reloading, which saves a lot of time and makes the inspection process easier for developers.
How to open Rendering Tool in Edge
The tool is present in DevTools you can open it by pressing F12 or “Ctrl+Shift+I” or right-clicking on the webpage and then pressing inspect from the context menu that appears. In DevTools, there are multiple ways to open the tool, which are:
Using the Add button: At the end of the main toolbar, you will find an Add button. Click the add button and select rendering from the list of tools that pops up.
Using More Tools: In the top-right corner of DevTools, click the three dots. Then navigate to More Tools > Rendering from the menu that appears.
Using Run Command: Press the shortcut key “Ctrl+Shift+P” or select Run Command from the menu in the three dots button, which is present in the top-right corner of DevTools. The Run Command search menu will appear. In that, type Rendering, and then select Show Rendering from the list of options that appears.
Multiple ways of opening Rendering Tool
Various options in Rendering Tool
The tool provides various checkboxes and emulates options. All of these options can be separated into three sections: rendering checkboxes, emulating options, and image format checkboxes.
Rendering checkboxes
The various checkboxes under this section allow you to enable rendering information or layout inspection.
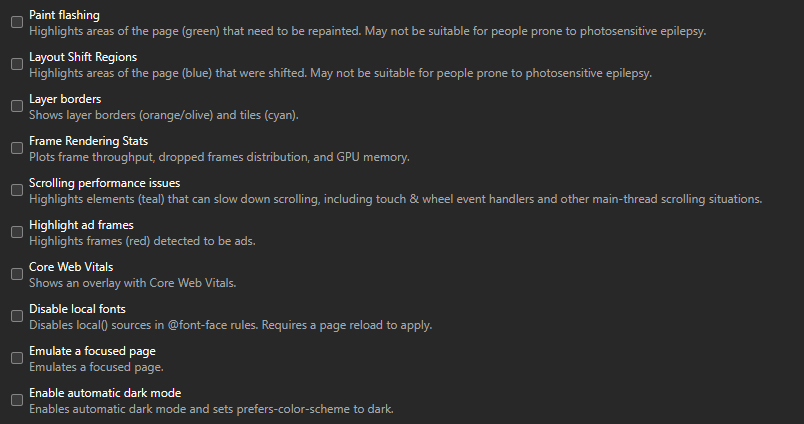
Various rendering checkboxes
- Paint flashing: If checked, then any frame that is repainted, i.e., any changes in the elements, are highlighted in green.
- Layout Shift Regions: If checked, then any shifted layout is highlighted in blue.
- Layout borders: If checked, then the layer borders are displayed in orange and the tiles are displayed in cyan lines.
- Frame Rendering Stats: If checked, then in the top-left corner of the web page you get frame rate, GPU raster, and memory information.
- Scrolling performance issues: If checked, then in the web page elements get highlighted: yellow is for touch events, orange is for elements that repaint on scroll, lemon green is for mouse wheel events, and teal is for elements that slow down scrolling.
- Highlight ad frames: If checked, then any ads on the site are highlighted in red.
- Core Web Vitals: If checked, then in the top-right corner of the web page you get the largest contentful paint time, first input delay, and cumulative layout shift value.
- Disable local fonts: If checked, then any local fonts that are added to the src property under the @font-face rule in the CSS of the web page get disabled.
- Emulate a focused page: If checked, then the web page will stay focused even though you focus elsewhere.
- Enable automatic dark mode: If checked, then it sets the prefers-color-scheme media feature to dark.
Emulate options
The section includes various options to emulate CSS media features and visual deficiency.
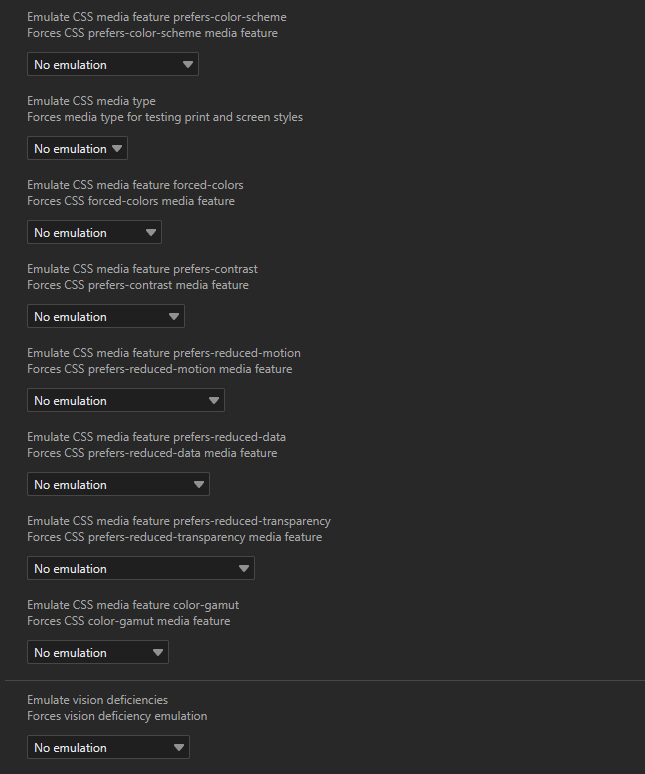
Various emulate options
- Emulate prefers-color-scheme: Use to set the prefers-color-scheme to dark or light if it is present in the media queries of the CSS in the web page.
- Emulate media type: You can set the media type to print or screen if it is present in the media queries of the CSS in the web page.
- Emulate forced colors: Activate the forced colors if they are present in the media queries of the CSS on the web page.
- Emulate prefers-contrast: You can set the prefers-contrast to more, less, or custom if it is present in the media queries of the CSS in the web page.
- Emulate prefers-reduced-motion: Set the prefers-reduced-motion to reduce if it is present in the media queries of the CSS in the web page.
- Emulate prefers-reduced-data: Set to reduce if it is present in the media queries of the CSS in the web page.
- Emulate prefers-reduced-transparency: Set prefers-reduced-transparency to reduce if it is present in the media queries of the CSS in the web page.
- Emulate color-gamut: Use the color-gamut to srg, p3, or rec202 if it is present in the media queries of the CSS on the web page.
- Emulate vision deficiencies: You can emulate visual deficiencies, which include blurred vision, reduced contrast, and various types of color blindness.
Image format checkboxes
This section just provides checkboxes to disable image format.
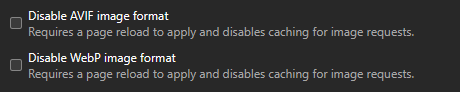
Various image format checkboxes
- Disable AVIF image format: If checked, then it disables the AVIF image format to cache in the browser, and don’t forget to reload the page for it to work.
- Disable WebP image format: If checked, then it disables WebP image format to cache in the browser, and don’t forget to reload the page for it to work.
Showing usage of Rendering Tool
Let’s visit the GFG site and use the tool to inspect and emulate various options related to rendering and colors.
Step 1: Using Edge, visit the GFG web page and then locate the rendering tool in DevTools.
Step 2: Use the tool for various rendering options to inspect the site.
Using the Rendering Tool in GFG site.
Note: Close DevTools to reset all the rendering tool options.
Conclusion
To test a site for various layout and design issues, developers do not need to use multiple devices to test the web page; they can use the Rendering Tool. The tool allows you to emulate various CSS states and visual deficiencies and provide information about the layout of the web page.
Share your thoughts in the comments
Please Login to comment...