Introduction to MATLAB
Last Updated :
01 Mar, 2024
MATLAB stands for Matrix Laboratory. It is a high-performance language that is used for technical computing. It was developed by Cleve Molar of the company MathWorks.Inc in the year 1984.It is written in C, C++, Java. It allows matrix manipulations, plotting of functions, implementation of algorithms and creation of user interfaces.
Getting Started with MATLAB
It is both a programming language as well as a programming environment. It allows the computation of statements in the command window itself.
- Command Window: In this window one must type and immediately execute the statements, as it requires quick prototyping. These statements cannot be saved. Thus, this is can be used for small, easily executable programs.
- Editor (Script): In this window one can execute larger programs with multiple statements, and complex functions These can be saved and are done with the file extension ‘.m ‘
- Workspace: In this window the values of the variables that are created in the course of the program (in the editor) are displayed.
- Command History window : This window displays a log of statements that you ran in the current and previous MATLAB sessions. The Command History lists the time and date of each session in the short date format for your operating system, followed by the statements from that session.
- This window displays the exact location(path) of the program file being created.
MATLAB Library comes with a set of many inbuilt functions. These functions mostly perform mathematical operations like sine, cosine and tangent. They perform more complex functions too like finding the inverse and determinant of a matrix, cross product and dot product Although MATLAB is encoded in C, C++ and Java, it is a lot easier to implement than these three languages. For example, unlike the other three, no header files need to be initialised in the beginning of the document and for declaring a variable, the data type need not be provided. It provides an easier alternative for vector operations. They can be performed using one command instead of multiple statements in a for or while loop.
Basic Functions in MATLAB
| Function |
Description |
| disp() |
The values or the text printed within single quotes is displayed on the output screen |
| clear |
To clear all variables |
| close all |
To close all graphics window |
| clc |
To clear the command window |
| exp(x) |
To compute the exponential value of x to the base e |
| abs(x) |
To compute the absolute value of x |
| sqrt(x) |
To compute the square root of x |
| log(x) |
To compute the logarithmic value of x to the base e |
| log10(x) |
To compute the logarithmic value of x to the base 10 |
| rem(x, y) |
To compute the remainder of x/y |
| sin(x) |
To compute the sine of x |
| cos(x) |
To compute the cosine of x |
| tan(x) |
To compute the tangent of x |
| atan2(x, y) |
To compute the arctangent or inverse of y/x |
Writing a MATLAB Program
- Using Command Window: Only one statement can be typed and executed at a time. It executes the statement when the enter key is pressed. This is mostly used for simple calculations. Note: ans is a default variable created by MATLAB that stores the output of the given computation.
- Using Editor: Multiple lines of code can be written here and only after pressing the run button (or F5) will the code be executed. It is always a good practice to write clc, clear and close all in the beginning of the program.Note: Statements ending with a semicolon will not be displayed in the command window, however, their values will be displayed in the workspace. Any statement followed by % in MATLAB is considered as a comment
- Vector Operations: Operations such as addition, subtraction, multiplication and division can be done using a single command instead of multiple loops
We can also extract separate rows and columns by using the colon(:) operator. Consider a matrix A of size 3X3. The following commands can be used to extract rows and columns from Matrix A
| Command |
Description |
| A(:, n) |
To extract the elements of all rows in column n of the matrix |
| A(m, : ) |
To extract the elements of all columns in row m of the matrix |
| A(:, m:n) |
To extract the elements of all rows between columns m and n of the matrix |
| A(m:n, : ) |
To extract the elements of all columns between rows m and n of the matrix |
| A(p:q, m:n) |
To extract the elements of rows between p and q and columns between m and n of the matrix |
| A(m, n) |
To extract the elements of row m and column n |
Plotting in MATLAB
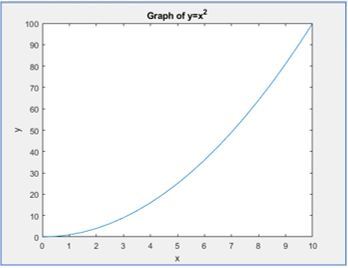
The MATLAB graphics system consists of high-level commands for two-dimensional and three-dimensional data visualization, image processing, animation, and presentation graphics. It also includes low-level commands that allows to fully customize the appearance of graphics as well as to build complete Graphical User Interfaces. Given below is a code for plotting a Parabola:
x = 0:0.5:10;
%Indicates that x varies from 0 to 10 with intervals of 0.5
y = x>^2;
%Indicates that square of each element in x is stored in y
plot(x, y)%plotting x and y
xlabel(X)%naming x axis as x
ylabel(Y)%naming y axis as y
title('Graph of y=x^2')%Title of the graph
This code will give the following graph:
You can change the color of the graph by adding another statement in the plot command. For example, plot(x, y, ‘r’) will give the graph line in red. Graphs such as sine, cosine and other trigonometric functions’ curve can also be plotted. The code for sine curve is given below:
x = 0:pi/100:2*pi;
y = sin(x);
plot(x, y, ‘g’)%Will give the graph line in green.MATLAB is a very user friendly language and it is also easy to understand.It’s library is equipped with functions that help us perform a variety of mathematical functions.
Share your thoughts in the comments
Please Login to comment...