This article explains the significance of interactive controls in Jupyter Notebooks and presents a few different methods of adding them to the notebooks for Python programming language. A list of basic controls/widgets and finally examples are provided to demonstrate all that is presented throughout this article. This article expects basic familiarity with Python and Jupyter Notebooks.
Interactive Controls for Jupyter Notebooks
We often need to explore figures and data in Jupyter notebooks by observing it for different values of parameters involved. The obvious solution is to change the value of parameters in the code and then run it and repeat this process for the different values we are targeting. In practice, this process becomes inconvenient and frustrating as the number of parameters and the possible values for each parameter that we want to explore grows. One solution for this problem is Jupiter interactive controls which can be added by using Jupyter widgets.
Jupyter widgets can be used in a variety of situations:
- Data/Figure exploration through altering parameters.
- While presenting data in a jupyter notebook during the presentation.
- Creating small data dashboards within jupyter notebooks.
Installations and setup required
To work out the programs presented in this article, one needs to install Python, Jupyterlab, ipywidgets, matplotlib, and numpy on the pc along with a browser (Chrome, Edge, Firefox, Safari, etc.). Once the Python interpreter is installed, others can be installed with any Python package manager like pip or conda. Here are the commands for pip –
For Windows:
py -m pip install --upgrade "jupyterlab", "matplotlib", "numpy", "ipywidgets"
For Linux/Mac:
python3 -m pip install --upgrade "jupyterlab", "matplotlib", "numpy", "ipywidgets"
Once all these are installed, go to the project folder/the folder in which you want to keep the jupyter files and open the command window (terminal/console) there. Run the following command to launch the jupyter notebook in browser with this folder as the project folder –
For Windows
py -m jupyter lab
For Linux/Mac
python3 -m jupyter lab
Basic Interactive widgets in Jupyter Notebooks
Lots of widgets are available in ipywidgets for jupyter notebooks. The complete list can be obtained here on the official documentation. This section provides the syntax and usage of few basic widgets –
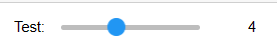
IntSlider
Creates an integer slider.
To use with interact decorator, put the default value of the parameter to an integer (like 1, 0, -1, 2, etc.).
To use with interact function, here is the code for the widget –
Python3
widgets.IntSlider(
value=7,
min=0,
max=10,
step=1,
description='Test:',
disabled=False,
continuous_update=False,
orientation='horizontal',
readout=True,
readout_format='d'
)
|
Output:
FloatSlider
Creates a float slider.
To use with interact decorator, put the default value of the parameter to an integer (like 1.0, 0.5, -1.2, 2.001, etc.).
To use with interact function, here is the code for the widget –
Python3
widgets.FloatSlider(
value=7.5,
min=0,
max=10.0,
step=0.1,
description='Test:',
disabled=False,
continuous_update=False,
orientation='horizontal',
readout=True,
|
Output:

Text
An entry box for text.
To use with interact decorator, put the default value of the parameter to a string.
To use with interact function, here is the code for the widget –
Python3
widgets.Text(
value='Hello World',
placeholder='Type something',
description='String:',
disabled=False
)
|
Output:

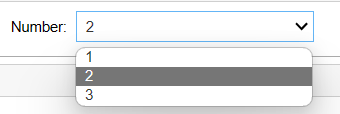
Dropdown
Creates a dropdown menu.
To use with interact decorator, put the default value of the parameter to a sequence (like list or tuple).
To use with the interact function, here is the code for the widget –
Python3
widgets.Dropdown(
options=['1', '2', '3'],
value='2',
description='Number:',
disabled=False,
)
|
Output:
DropBox
Checkbox
Creates a checkbox for boolean values (True/False).
To use with interact decorator, put the default value of the parameter to True or False.
To use with the interact function, here is the code for the widget –
Python3
widgets.Checkbox(
value=False,
description='Check me',
disabled=False,
indent=False
)
|
Output:

Checkbox
We use some of these widgets in the proceeding examples. To know more about these widgets and all the other jupyter widgets, visit the link to official documentation.
Apart from the widgets discussed here, backends for matplotlib, plotly and bokeh libraries are available to allow implementing their specific interactive plotting widgets. This is covered in the following article – How to Use JupyterLab Inline Interactive Plots
Methods for Interactive controls in Jupyter Notebooks
To add interactive controls, we need to follow the following steps –
- Step 1: Wrap the code which you want to be interactive inside a function with parameters that you want to alter. Now use these parameter variables inside the code to set the properties or whatever needs to be done using the parameters.
- Step 2: Use the interact or interact_manual functions from ipywidgets module to call this function.
The interact and interact_manual methods are same except for one difference that the output auto updates as we change the parameters through widgets in case of interact while in case of interact_manual a button is provided to update the output.
Hence use interact_manual when it is computationally expensive to produce the output (so you update only when you are ready to) otherwise use interact.
Custom Interactive Controls in jupyter notebooks
1. using @interact decorator
This is the easiest way to add interactive widgets. Import the interact function from ipywidgets. Wrap the code you want to be interactive in a function with the parameters having a default value. Put @interact decorator above this function. On execution, the interact decorator creates widgets for each of the parameters of the wrapper function. The default values for the parameters are necessary because the interact decorator inferences the widget type using these values.
In this example, we plot a circle and provide interactive widgets to alter its linewidth, boundary color and radius. We start with putting %matplotlib widget which specifies that we want an interactive matplotlib figure (which can be zoomed, panned and saved). Next we import the necessary libraries and objects and define a function named circle to plot the circle. It contains arguments/parameters which we want to alter with interactive widgets and they have default values to be used with the interact decorator as described in earlier sections. Now we define the code to plot the circle inside this function and use these parameters wherever the alterable property is to be specified. Finally decorate the circle function with @interact.
Python3
%matplotlib widget
import numpy as np
import matplotlib.pyplot as plt
from ipywidgets import interact, widgets
@interact
def circle(radius=1.0, linewidth=1, color = ['red', 'blue', 'green']):
angles = np.linspace(0,2*np.pi,100)
fig, ax = plt.subplots()
ax.set_aspect(1)
ax.set_xlim(-10,10)
ax.set_ylim(-10,10)
ax.plot(radius*np.cos(angles), radius*np.sin(angles), linewidth = linewidth, c = color)
plt.show()
|
Output:
2. using interact function call
This example improves the last example by using interact function call (instead of decorator) which allows greater flexibility as it allows specifying a widget for each parameter. We can remove the default arguments here. We use the interact function as shown earlier. Using this flexibility, we improve certain things like setting max and min for radius and linewidth. Earlier example provided a slider for linewidth which can be slided below 0. This is not desirable since specifying linewidth below 0 is meaningless, hence we specify the min of its slider to 0. Also, instead of a list of colors, we provided a color picker widget which allows the user to pick just any color.
Python3
%matplotlib widget
import numpy as np
import matplotlib.pyplot as plt
from ipywidgets import interact, widgets
def circle(radius, linewidth, color):
angles = np.linspace(0,2*np.pi,100)
fig, ax = plt.subplots()
ax.set_aspect(1)
ax.set_xlim(-10,10)
ax.set_ylim(-10,10)
ax.plot(radius*np.cos(angles), radius*np.sin(angles), linewidth = linewidth, c = color)
plt.title('Circle of radius {} units'.format(radius))
plt.show()
interact(
circle,
radius = widgets.FloatSlider(min = 0, max = 10, value = 1),
linewidth = widgets.IntSlider(min = 0, max = 5, value = 1),
color = widgets.ColorPicker()
)
|
Output:
Using the interact_manual function/decorator
When you want to turn off auto-update, just replace the interact decorator or function with interact_manual keeping rest of the things unchanged. Auto update will be turned off and you will get an update button as shown in this example –
Python3
import matplotlib.pyplot as plt
from ipywidgets import interact_manual, widgets
@interact_manual
def wrapperFunction(x = 5,y = 4):
plt.xlim(0,10)
plt.ylim(0,10)
plt.plot(x,y,marker = 'o')
plt.show()
|
Output:

Example of interactive controls in Jupyter Notebook using interact_manual from ipywidgets.
Notice that “Run Interact” button in the output. It should be clicked to update the output.
Note: We used matplotlib here, but one can use any plotting library that jupyter supports like plotly, bokeh, etc. inside the wrapper function because the code inside the wrapper function doesn’t matter for the interactive widgets.
Interactive scatter plot with IPywidgets controls
It is an interactive 3D scatter plot using IPywidgets and Matplotlib. It will display three sliders that allow you to interactively adjust the limits of the 3D scatter plot along the X, Y, and Z axes. The plot updates dynamically as you move the sliders, providing an interactive exploration of the 3D scatter plot.
Python3
import numpy as np
import matplotlib.pyplot as plt
from mpl_toolkits.mplot3d import Axes3D
import ipywidgets as widgets
from IPython.display import display
np.random.seed(42)
x_data = np.random.rand(50)
y_data = np.random.rand(50)
z_data = np.random.rand(50)
def create_3d_scatter_plot(x_limit, y_limit, z_limit):
fig = plt.figure(figsize=(10, 8))
ax = fig.add_subplot(111, projection='3d')
ax.scatter(x_data, y_data, z_data, label='Scatter Plot', c='red', marker='o')
ax.set_title('Interactive 3D Scatter Plot')
ax.set_xlabel('X-axis')
ax.set_ylabel('Y-axis')
ax.set_zlabel('Z-axis')
ax.set_xlim(0, x_limit)
ax.set_ylim(0, y_limit)
ax.set_zlim(0, z_limit)
ax.legend()
plt.show()
x_limit_slider = widgets.FloatSlider(value=1.0, min=0.1, max=2.0, step=0.1, description='X-axis Limit:')
y_limit_slider = widgets.FloatSlider(value=1.0, min=0.1, max=2.0, step=0.1, description='Y-axis Limit:')
z_limit_slider = widgets.FloatSlider(value=1.0, min=0.1, max=2.0, step=0.1, description='Z-axis Limit:')
def update_plot(change):
create_3d_scatter_plot(x_limit_slider.value, y_limit_slider.value, z_limit_slider.value)
x_limit_slider.observe(update_plot, 'value')
y_limit_slider.observe(update_plot, 'value')
z_limit_slider.observe(update_plot, 'value')
display(x_limit_slider)
display(y_limit_slider)
display(z_limit_slider)
create_3d_scatter_plot(x_limit_slider.value, y_limit_slider.value, z_limit_slider.value)
|
Output:
Browsing images using IPython widgets
We can put in the name of a folder and the file dropdown will list all the image files (ending with .png, .jpg, .jpeg and .gif). We can select an image to show. Moreover, one can choose to apply the blur radius using checkbox and select the blur radius through the slider. We need flexibility in deciding and defining widgets so we naturally use the method of calling interact function explicitly here. The code structure is almost similar to the last example except that we observe any changes in value of folder input widget. Whenever its value changes, we update the file selection (dropdown) widget to list all the image files in that folder and show the first one by default. To work with the image we need to install pillow library which must be installed using pip as all the other modules were installed earlier.
Python3
%matplotlib widget
import matplotlib.pyplot as plt
from ipywidgets import interact, widgets
import numpy as np
import os
from PIL import Image, ImageFilter
def imageEditor(folder, filename, blur, blurRadius):
im = Image.open('{}\\{}'.format(folder, filename))
if(blur == True):
im = im.filter(ImageFilter.GaussianBlur(blurRadius))
plt.imshow(im)
plt.axis('off')
plt.show()
folderWidget = widgets.Text(value = os.getcwd() + '\\images\\pngFiles')
fileWidget = widgets.Dropdown(options = os.listdir(folderWidget.value))
def updateFilesList(*args):
filesList = [file for file in os.listdir(folderWidget.value) if file.endswith(('.png', '.jpg', '.jpeg','.gif'))]
fileWidget.options = filesList
fileWidget.value = filesList[0]
folderWidget.observe(updateFilesList, 'value')
interact(
imageEditor,
filename = fileWidget,
folder = folderWidget,
blur = widgets.Checkbox(value = False),
blurRadius = widgets.FloatSlider(min = 0, max = 5, description = "Blur Radius")
)
|
Output:
Interactive Paraboloid
Now the reader has enough knowledge to understand the code for the paraboloid example shown in the cover video. Here is the code for the paraboloid with interactive controls shown in cover video –
Python3
from ipywidgets import interact
import numpy as np
import matplotlib.pyplot as plt
from mpl_toolkits.mplot3d import Axes3D
def plot_paraboloid(height=1.0, radius=1.0, rotation=5.0, colormap='viridis'):
u = np.linspace(0, 1, 20)
v = np.linspace(0, 2 * np.pi, 20)
u, v = np.meshgrid(u, v)
x = radius * ((u / height) ** 0.5) * np.cos(v)
y = radius * ((u / height) ** 0.5) * np.sin(v)
z = u
fig = plt.figure()
ax = fig.add_subplot(111, projection='3d')
ax.set_aspect('equal')
ax.set_xlim(-1.5, 1.5)
ax.set_ylim(-1.5, 1.5)
ax.set_zlim(0, 1)
ax.plot_surface(x, y, z, cmap=colormap)
ax.view_init(elev=20, azim=rotation)
plt.show()
interact(plot_paraboloid, height=(0.1, 2.0), radius=(0.1, 2.0),
rotation=(-180, 180), colormap=['viridis', 'Blues', 'magma_r'])
|
Output:
Interactive 3D Surface Plot
It creates an interactive 3D surface plot using IPywidgets and Matplotlib. The sliders for adjusting the values of a, b, and c, as well as a dropdown menu for selecting different colormaps. The 3D surface plot dynamically updates as you interact with the sliders and colormap menu.
Python3
from ipywidgets import interact
import numpy as np
import matplotlib.pyplot as plt
from mpl_toolkits.mplot3d import Axes3D
def surface_plot(a=1, b=1, c=1, colormap='viridis'):
x = np.linspace(-5, 5, 100)
y = np.linspace(-5, 5, 100)
x, y = np.meshgrid(x, y)
z = a * np.exp(-(x**2 + y**2) / (2*c**2))
fig = plt.figure()
ax = fig.add_subplot(111, projection='3d')
ax.plot_surface(x, y, z, cmap=colormap)
ax.set_xlabel('X-axis')
ax.set_ylabel('Y-axis')
ax.set_zlabel('Z-axis')
ax.set_title('3D Surface Plot')
plt.show()
interact(surface_plot, a=(0.1, 2.0), b=(0.1, 2.0), c=(0.1, 2.0), colormap=['viridis', 'Blues', 'magma_r'])
|
Output:
Conclusion
Interactive controls can be easily added in jupyter notebooks using jupyter widgets to conveniently explore and handle the changing parameters. We can do so using interact and interact_manual functions from the ipywidgets module. The difference between them is that interact auto updates the output while interact_manual provides a button to update it. Both can be used as decorators and as function calls. Decorators automatically create the widgets by inferencing from the default values of the parameters given to the wrapper function, hence are easier to use. Function call is more useful when we want flexibility and want to explicitly control what widget to use and its properties.
Share your thoughts in the comments
Please Login to comment...