Swagger and API Monitoring
Last Updated :
29 Jan, 2024
API monitoring is like having a watchful guardian for your digital communication paths, playing a big role in making software work well. It keeps an eye on how things are going, manages mistakes, makes sure everything responds quickly, checks everything in real-time, makes the user experience better, and fixes problems before they become big issues.
In the world of making software today, both Swagger (now called the OpenAPI Specification) and API monitoring are really important. Swagger helps make a plan for how to build APIs, making it easier to create them and check how well they work. API monitoring keeps an eye on APIs all the time, making sure they keep working well. Together, these tools help a lot in creating, explaining, testing, and making sure APIs work great in the digital world.
What is API Monitoring?
API Monitoring is like a watchman for your digital stuff. It checks how everything is doing in real time, making sure it works well and responds fast. It keeps an eye on things like how often there are mistakes and if everything is working smoothly. By catching problems early, it helps fix things before you even notice, making sure your digital experience is good and the software works well.
Swagger and API Monitoring
Below, we will understand how the Swagger and API Monitoring work step-by-step with one example by creating Public API and Private API and how we manage it.
Step 1: Create a Virtual Environment
First, create the virtual environment using the below commands
python -m venv env .\env\Scripts\activate.ps1
Step 2: Install Necessary Library
To set up the required dependencies, begin by installing Flask, Flasgger, and Prometheus_client using the following commands:
pip install flask
pip install flasgger
pip install prometheus_client
Step 3: Import the Necessary Library
Using the below command import the Necessary Library
Python3
from flask import Flask, jsonify, request
from flasgger import Swagger
from prometheus_client import Counter, generate_latest, REGISTRY, start_http_server
|
Step 4: Create the Prometheus metrics
Prometheus metrics are a standardized method to measure and monitor software system performance. In API monitoring, they enable real-time tracking, helping proactively resolve issues and ensuring optimal API health for a reliable user experience.
In below code we defines a Prometheus metrics endpoint in a Flask app at the ‘/metrics’ route. When accessed, it returns Prometheus metrics data using the `generate_latest` function from the provided `REGISTRY`. The endpoint is documented using Swagger/OpenAPI. We can see the Prometheus metrics by below accessing below url
http://127.0.0.1:8000/metrics
Python3
@app.route('/metrics', methods=['GET'])
def metrics():
return generate_latest(REGISTRY)
|
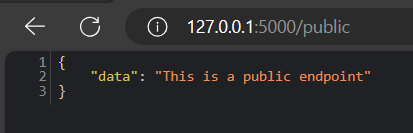
Step 3: Create Public API
Below , code defines a Flask endpoint at ‘/public’ with a Swagger documentation comment. When accessed via a GET request, the endpoint increments a ‘http_requests_total’ counter (assumed to be defined elsewhere) and responds with a JSON object containing a ‘data’ field with the string value ‘This is a public endpoint’.
Python3
@app.route('/public', methods=['GET'])
def public_endpoint():
requests_counter.inc()
return jsonify({'data': 'This is a public endpoint'})
|
Output :
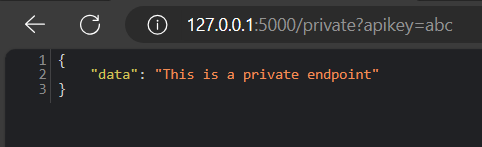
Step 4: Create Private API
Below, code defines a Flask endpoint at ‘/private’ with Swagger documentation. When accessed via a GET request, it increments a ‘http_requests_total’ counter (assumed to be defined elsewhere). The endpoint expects an ‘apikey’ parameter in the query, and it responds with a JSON object containing a ‘data’ field if the provided API key is ‘abc’. If the API key is invalid, it returns a JSON object with an ‘error’ field .
Python3
@app.route('/private', methods=['GET'])
def private_endpoint():
requests_counter.inc()
api_key = request.args.get('apikey')
if api_key != 'abc':
return jsonify({'error': 'Invalid API key'}), 401
return jsonify({'data': 'This is a private endpoint'})
|
Output :
Complete Code
Below, code sets up a Flask app with Swagger documentation, Prometheus metrics, and two endpoints. The ‘/public’ endpoint responds to any request, incrementing a request counter. The ‘/private’ endpoint requires an API key as a query parameter, and only allows access if the key is ‘abc’. Prometheus metrics, including an ‘http_requests_total’ counter, are exposed at the ‘/metrics’ endpoint. The app runs on port 5000, and a Prometheus HTTP server is started on port 8000 for monitoring.
Python3
from flask import Flask, jsonify, request
from flasgger import Swagger
from prometheus_client import Counter, generate_latest, REGISTRY, start_http_server
app = Flask(__name__)
swagger = Swagger(app)
requests_counter = Counter('http_requests_total', 'Total HTTP requests')
@app.route('/metrics', methods=['GET'])
def metrics():
return generate_latest(REGISTRY)
@app.route('/public', methods=['GET'])
def public_endpoint():
requests_counter.inc()
return jsonify({'data': 'This is a public endpoint'})
@app.route('/private', methods=['GET'])
def private_endpoint():
requests_counter.inc()
api_key = request.args.get('apikey')
if api_key != 'abc':
return jsonify({'error': 'Invalid API key'}), 401
return jsonify({'data': 'This is a private endpoint'})
if __name__ == '__main__':
start_http_server(8000)
app.run(debug=True, port=5000)
|
Run the Server
Using the below command we can run the server and Access the Swagger documentation
python app.py
http://127.0.0.1:5000/apidocs
Output
Conclusion
In conclusion, integrating Swagger with Flask and adding monitoring metrics to API development is crucial for optimal performance. This combination streamlines API design and testing, while tools like Prometheus offer real-time insights. Following the provided steps and code allows firsthand experience in creating a robust and well-monitored API. The demo video aids implementation, ensuring efficiency and reliability in digital communication through Swagger, API monitoring, and best practices.
Share your thoughts in the comments
Please Login to comment...