Plot Expression or Function in MATLAB
Last Updated :
28 Apr, 2021
In this article, we will discuss how to plot expressions or functions in MATLAB. We can make use fplot() function in MATLAB to generate the plot corresponding to an expression or function.
There are different variants of fplot() function
- fplot(f)
- fplot(f,xinterval)
- fplot(___,LineSpec)
- fplot(___,Name,Value)
Now discussing each variant in detail. Below are the various ways to plot an expression or a function in MATLAB:
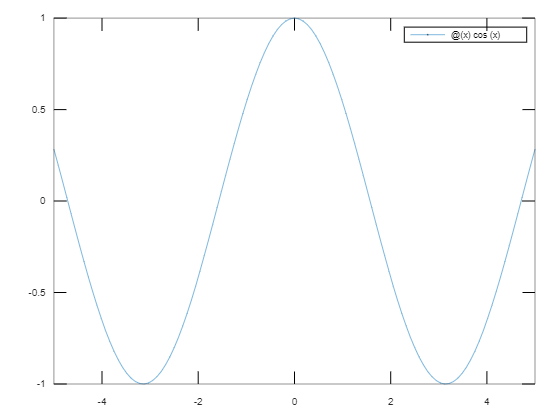
fplot(f): Plots the expression passed to it as a parameter.
Example : Plotting cos(x) function in default interval [-5 5]
Output :
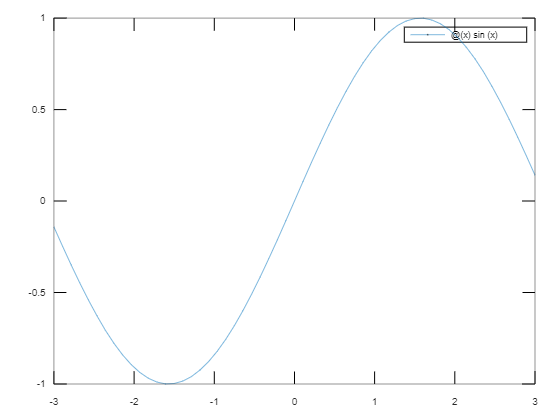
fplot(f,xinterval): Plots the curve defined by function y = f(x) in the specified interval. Specify the interval as a two-element vector of the form [xmin xmax].
Example : Plotting cos(x) function in the interval [-3 3].
Matlab
fplot(@(x) sin(x),[-3 3])
|
Output :
fplot(___,LineSpec)
- It allows specifying the line properties such as line style, marker symbol, and color.
- For example, ‘b’ plots a blue line. We can specify these properties after specifying the function and the interval.
- Line style, marker, and color, specified as a character vector or string containing symbols in any order. For example: ‘-*r’ means red solid line with Asterisk. You can also omit some properties.
Some values of each property are
| Linestyle |
Meaning |
Marker |
Meaning |
Color |
Meaning |
| ‘-‘ |
Solid |
‘o’ |
Circle |
‘r’ |
Red |
| ‘:’ |
Dotted |
‘+’ |
Plus sign |
‘q’ |
Green |
| ‘–‘ |
Dashed |
‘*’ |
Asterik |
‘b’ |
Blue |
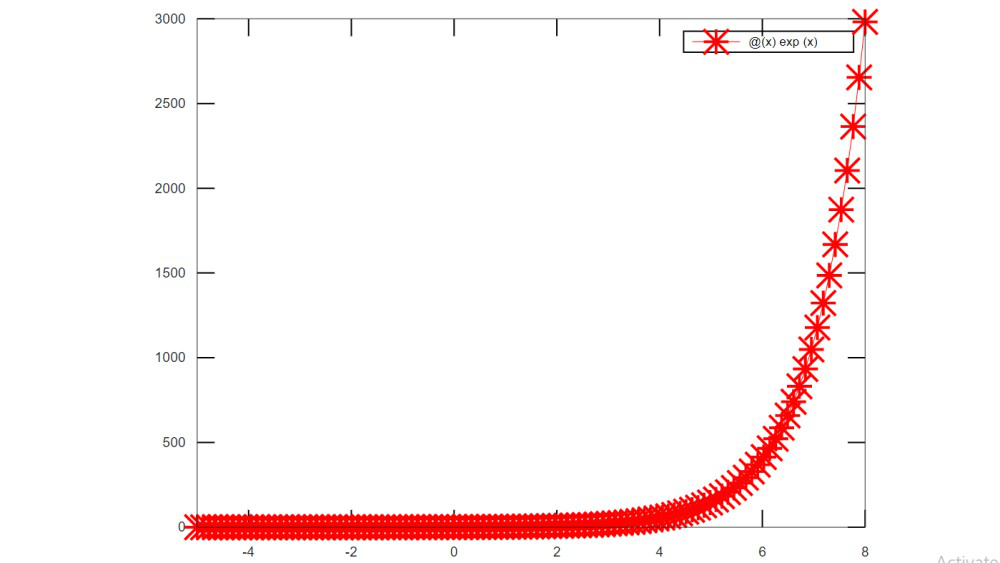
Example : Plotting exp(x) function in the interval [-5 8] with a red solid line with star marker.
Matlab
fplot(@(x) exp(x),[-5 8],'-*r')
|
Output :
fplot(___,Name,Value)
- Another way to specify the properties of line with Name-Value pair of arguments.
- For example ‘Color’, ‘r’ indicated the red line.
- We can also specify properties such as LineWidth, Marker, Color, LineStyle.
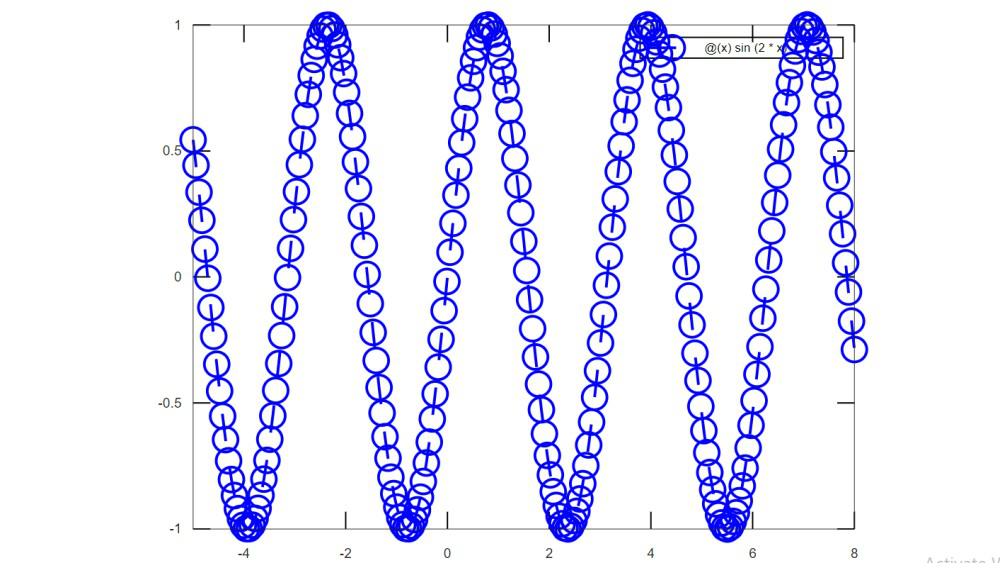
Example : Plot the sin(2x) function with a linewidth of 2, and blue dotted line with a circle marker by specifying their name and value pairs.
Matlab
fplot(@(x) sin(2*x),[-5 8],'Color','b','Marker','o',
'LineWidth',2,'LineStyle','--')
|
Output :
We can depict multiple expressions in a single plot. Below is an example where we plot sin(x) and cos(2*x) in the same illustration:
Matlab
fplot(@(x) sin(x))
hold on
fplot(@(x) cos(2*x))
hold off
|
Output :
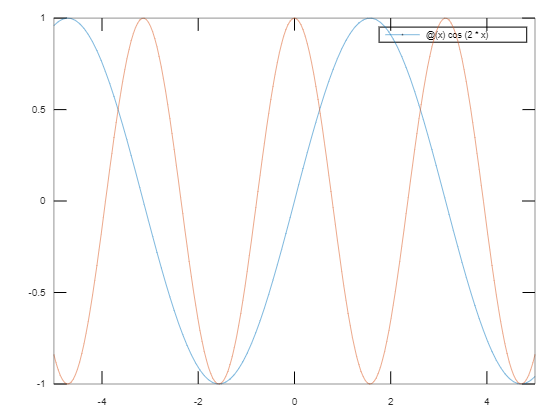
In the above program, we depict two expressions in the same plot. The hold keyword is used in MATLAB to hold on and hold off expressions in a plot.
Share your thoughts in the comments
Please Login to comment...