How to Normalize a Histogram in MATLAB?
Last Updated :
08 Dec, 2021
Histogram normalization is a technique to distribute the frequencies of the histogram over a wider range than the current range. This technique is used in image processing too. There we do histogram normalization for enhancing the contrast of poor contrasted images.
Formula:

Here ./ and .* means operation has to be performed element-wise.
Steps:
- Read the image.
- Convert color image into grayscale.
- Display histogram.
- Observe maximum and minimum intensities from the histogram.
- Change image type from uint8 to double.
- Apply a formula for histogram normalization.
- Convert back into unit format.
- Display image and modified histogram.
Example:
Matlab
k=imread("lincoln.jfif");
k1=rgb2gray(k);
imtool(k1,[]);
imhist(k1);
min=45;
max=180;
k2=double(k1);
k3=(k2-min)./(max-min);
k4=k3.*255;
k5=uint8(k4);
imtool(k5,[]);
imhist(k5);
|
Output:
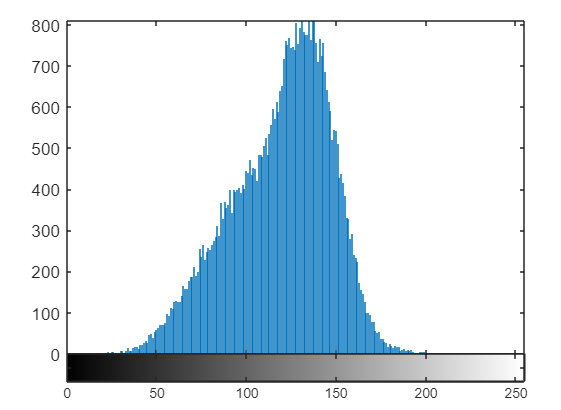
Figure: Original histogram
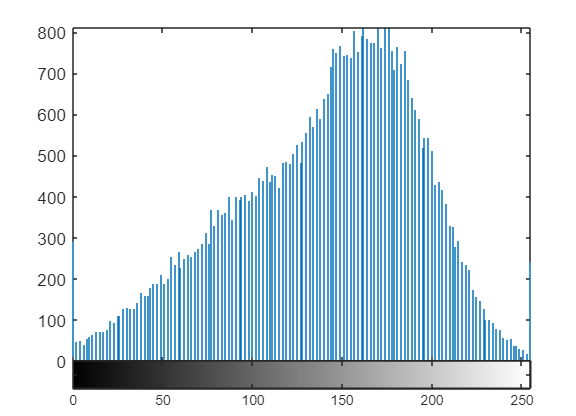
Figure: Normalized histogram
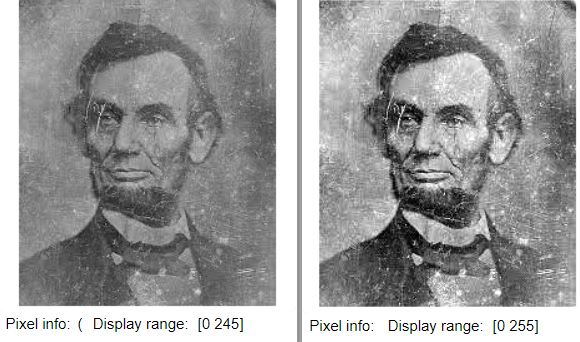
Figure: Images before and after normalization
Code Explanation:
- First, we read the image using imread( ) function.
- After reading the image, we convert it into the grayscale format.
- After converting it into grayscale, we displayed the image and its histogram.
- Maximum and minimum intensity is noted from the histogram.
- The image data type is changed from uint8 to double, to facilitate the calculation steps.
- Apply the formula of normalization.
- The image data type is changed back to uint8.
Share your thoughts in the comments
Please Login to comment...