Plot a 3D Contour in MATLAB
Last Updated :
21 Apr, 2021
Contour plots are used to show 3D surfaces by plotting z- slides on a 2D surface. A contour plot is also called a line plot. In contour, we have 3 variables x, y, z. The x, y variables are used to give the values for z, ( z=f(x, y)). The x and y variables are usually in a grid called meshgrid.
There are various contour plots in MATLAB like contour, contourf, contour3, contourc, countourslice, clabel, and fcontour. In this article, we will see how to plot 3D contour in MATLAB. To plot 3D contour we will use countour3() to plot different types of 3D modules.
Syntax:
- contour3(X,Y,Z): Specifies the x and y coordinates for the values in Z.
- contour3(Z): Creates a 3-D contour plot containing the isolines of matrix Z, where Z contains height values on the x-y plane.
- contour3(___,levels): Specify levels as a scalar value n to display the contour lines at n automatically chosen levels (heights).
- contour3(___,LineSpec): Specifies the style and color of the contour line.
Step-wise Approach:
- Enter the inputs for x and y in meshgrid function.
Matlab
[x,y]=meshgrid(-5 : 0.1 :5);
|
- Pass the value for z using x and y in an equation.
Matlab
z = x.^2 + y.^2 ;
disp(z);
|
- Use contour3 to plot 3d contour and to label the axis use label() method.
Matlab
contour3(z,25);
xlabel('x-axis');
ylabel('y-axis');
zlabel('z-axis');
title('3D contour');
|
Below is the complete program:
Matlab
[x,y]=meshgrid(-5 : 0.1 :5);
z = x.^2 + y.^2 ;
disp(z);
contour3(z,25);
xlabel('x-axis');
ylabel('y-axis');
zlabel('z-axis');
title('3D contour');
|
Output:

Example 1:
Here is another example similar to the previous one.
Matlab
[x,y]=meshgrid(-5 : 0.1 :5);
z = x.^2 - y.^2 ;
disp(z);
contour3(z,25);
xlabel('x-axis');
ylabel('y-axis');
zlabel('z-axis');
title('3D contour');
|
Output:

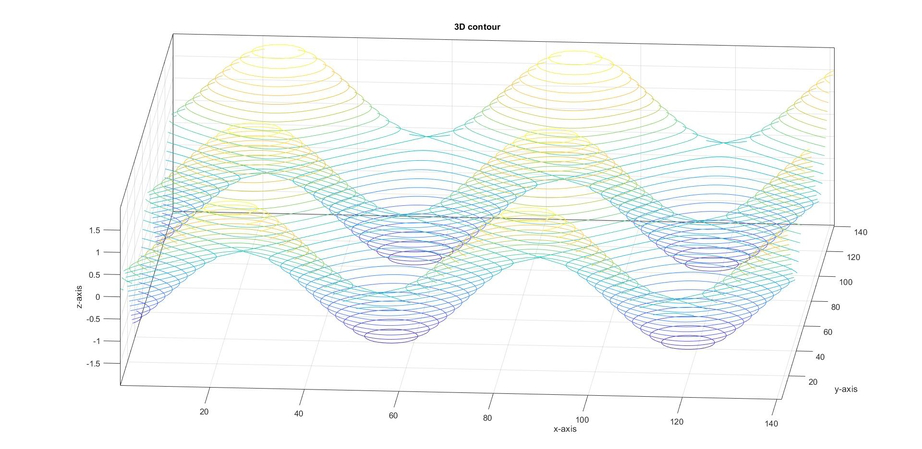
Example 2:
MATLAB program to generate a 3D Contour:
Matlab
[x,y]=meshgrid(-7 : 0.1 : 7);
z = sin(x)+ cos(y) ;
disp(z);
contour3(z,25);
xlabel('x-axis');
ylabel('y-axis');
zlabel('z-axis');
title('3D contour');
|
Output:
Like Article
Suggest improvement
Share your thoughts in the comments
Please Login to comment...