How to plot a Histogram in MATLAB ?
Last Updated :
06 Sep, 2021
A Histogram is a diagrammatic representation of a group of data over user-specified ranges. Basically, the histogram contains several bins. Bins are non-overlapping intervals in which the data is spread. In MATLAB we have a function named hist() which allows us to plot a bar graph.
Syntax:
hist(X)
where X represents the data. The X is a vector.
The histogram function uses an algorithm that returns bins and bins width are equal. And these bins spread according to the data given in vector. The interesting thing is that the height of each bin represents the number of points in that bin.
Now let’s move to some examples.
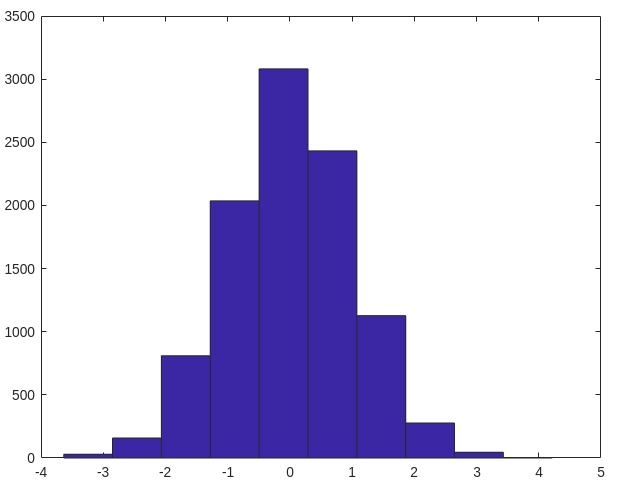
Example 1: A simple Histogram:
Output:
Example 2: Histogram with a given number of bins:
MATLAB
y=randn(10000,1)
nbins=50;
hist(y,nbins)
|
Output:

Example 3: Histogram of multiple columns:
Output :

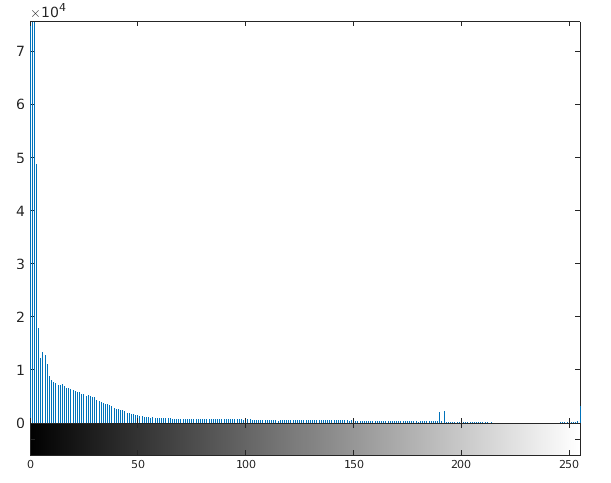
Example 4: Make Histogram of image:
MATLAB
I = imread('ngc6543a.jpg');
imshow(I)
|
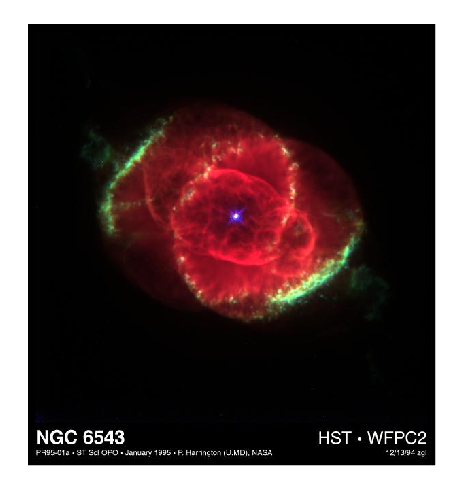
Output :
Share your thoughts in the comments
Please Login to comment...