What is an Infographic?
Last Updated :
23 Feb, 2024
At present, no one wants plain text to represent the information. In these situations, infographics come in handy to make your information visually pleasant to catch the audience’s attention. In this article, we will discuss about what is an infographic?, Why do people use it? and how can you make your infographics?

Infographic Designs
What is an Infographic?
Infographic also known as Information Graphic. As the name suggests, it is a visual representation of information in a graphic format that makes it easy to understand. It is a collection of graphics, data visualizations (such as bar graphs and pie charts), and simple text. Combining these elements, it’s an effective tool for presenting information and breaking down complicated problems into understandable chunks that may be grasped more quickly.
Types of Infographics
There are a total 9 types of Infographics:
- Statistical infographics
- Informational infographics
- Timeline infographics
- Process infographics
- Geographic infographics
- Comparison infographics
- Hierarchical infographics
- List infographics
- Resume infographics
Why use Infographics?
An infographic represents data in a format that is aesthetically pleasant and facilitates easy information understanding for the audience. As we know, Inforgraphics are getting popular day by day and the use of infographics has also increased. So here are some ways you can use infographics to your work:
- Presenting survey
- Research data
- Procedural instructions
- Resumes
- Timelines
How to Create an Infographic?
Creating an infographic is not that difficult if you have a clear idea what you want to represent. You can create an infographic by following these steps:
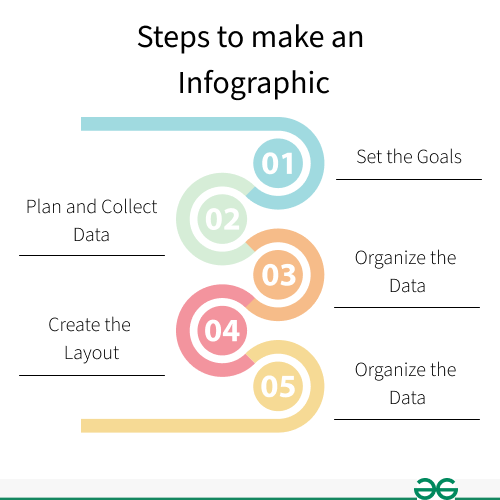
Creating Infographic Steps
Step 1- Set the Goals for your Infographic:
First set the attainable goals for the infographic design. It will be very difficult to design if you dont know what you want to represent and what your goals are.
Step 2- Plan and collect data for the content:
Collect the data you have and if not. Then can just simply start research on Google. There is a lot of data available for the public on the internet.
Step 3- Organize and visualize your data:
Now start organizing the data you collect and visualize what kind of infographic you want including groups, patterns, rank or order.
Step 4- Choose a template or create your layout:
Start creating the layout and design. One simple tactic that instantly increases your infographic is to lay out the elements in a predefined symmetrical grid.
Step 5- Add visual elements to make it stand out:
Now, here comes the fun part. Adding design elements to your infographic to make it visually pleasant. Don’t put too much elements, just try to keep it simple.
Now, you have a basic idea to create your first infographic design.
Importance of Using Visual Elements in an Infographic
The purpose of inforgraphics is to make the information visually pleasant. Without visual elements they are just plain text and now no one likes just plain text. So visual elements plays very impotant role in your infographics to catch the eye of the audience. Here are some commonly used visual elements:
- Colors
- Fonts
- Layout
- Images and Graphics
What Makes an Infographic Design Effective?
Infographics are used to communicate information to the people and sometimes the information can be very complex. A good infographic should be very clear, easy to understand and shouldn’t confuse people. It should be well designed and tell a clear story to your audience. There should not be any mystery in your story and the layout shoud not be very busy. Use a short and simple title that is catchy enough to grab the audience attention. Use the right fonts and colors that compliments your infographic. Don’t forget to promote your work. After completing the infographic upload it and share it on social media. Provide a link and call-to-action so peole can easily share your work.
FAQs about creating Infographics
What is Infographic?
It is combination of two words “Information” and “Graphic”. It is a visual representation of information in a graphic format that makes it easy to understand.
What are infographics used for?
There are so many ways you can use infographics in different industries. Infographics can be used to communicate complex information to the people in a simple visual format.
What are the top five infographics types?
Among the nine above mentioned infographics, these are the most commonly used:
- Statistical
- Informational
- Timeline
- Process
- Comparison
What are the top tools to make infographics?
There are so many tools available on the internet. Some popular tools are:
- Canva
- Google Charts
- Piktochart
- Venngage
- Visme
Share your thoughts in the comments
Please Login to comment...