How to put text on different lines to ggplot2 plot in R?
Last Updated :
09 Nov, 2021
ggplot2 is a plotting package in R programming language that is used to create complex plots from data specified in a data frame. It provides a more programmatic interface for specifying which variables to plot onto the graphical device, how they are displayed, and general visual properties.
In this article, we will discuss how to put text on different lines onto a plot using ggplot2 in R Programming Language.
Method 1 : Using annotate()
annotate() method in R is used to insert framed text into the plot. The annotate() method can be used to add both text as well shapes to the plots and data visualizations.
Syntax:
annotate ( “text” , x , y , label )
Arguments :
- x, y – The coordinates to add the text at
- label – The character string to add text to the plot.
The label attribute of the method can contain a string and “\n” symbol wherever we wish to break the line. This is the new line character that starts the text from the next line. This method can be used to plot the required lines or points as well as annotate text at specified positions for better clarity.
Example:
R
library(ggplot2)
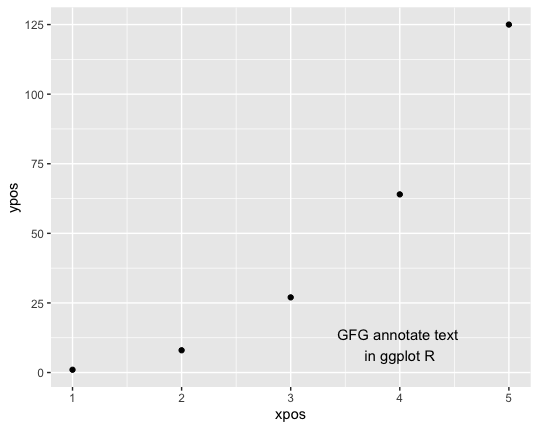
xpos <- 1:5
ypos <- xpos**3
data_frame <- data.frame(xpos = xpos, ypos = ypos)
text <- "GFG annotate text \nin ggplot R"
ggplot(data_frame, aes(xpos,ypos)) +
geom_point() + annotate ("text",
x = 4,
y = 10,
label = text)
|
Output
Method 2 : Using geom_text() method
The label attribute can be added to the data.frame() method while creating the data frame in R. The label attribute can be assigned to a string vector, equivalent to the number of points to a label contained in the data frame. The “\n” symbol can be inserted into the position within each component, to insert a line break.
The mappings in the ggplot method can be assigned to the labels of the data frame in order to assign the corresponding text at the respective coordinates of the data frame. The graphical representation can be then made to add text to the plot using the geom_text() method.
Example:
R
library(ggplot2)
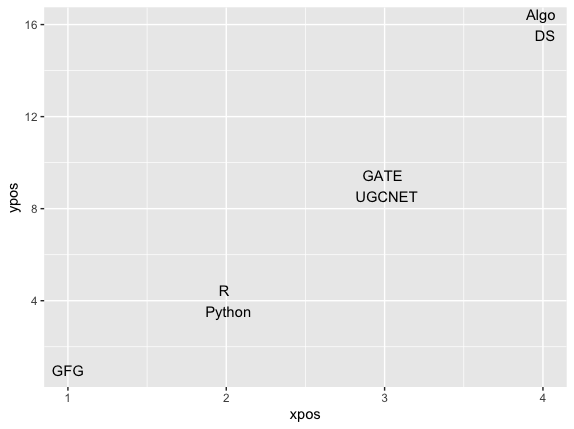
xpos <- 1:4
ypos <- xpos**2
labels <- c("GFG", "R \n Python","GATE \n UGCNET", "Algo \n DS")
data_frame <- data.frame(xpos = xpos, ypos = ypos, label=labels)
text <- "GFG annotate text \nin ggplot R"
ggplot(data_frame, aes(x=xpos, y=ypos, label=label)) +
geom_text()
|
Output
Share your thoughts in the comments
Please Login to comment...