Add Vertical and Horizontal Lines to ggplot2 Plot in R
Last Updated :
20 May, 2021
In this article, we will see how to add Vertical and Horizontal lines to the plot using ggplot2 in R Programming Language.
Adding Vertical Line To R Plot using geom_vline()
For adding the Vertical line to the R plot, geom_vline() draws a vertical line at a specified position.
Syntax: geom_vline(xintercept)
Parameter: here xintercept is used control the X position of line.
Return: Vertical line on R plot.
Example: To add the vertical line on the plot, we simply add geom_vline() function to ggplot2() function and pass the xintercept, which basically has a location on X-axis, where we actually want to create a vertical line. Here we set 2011 to the xintercept.
R
library(ggplot2)
data <- data.frame(year = c(2011, 2012, 2013, 2014, 2015),
point = c(10, 20, 30, 40, 50))
ggplot(data, aes(year, point)) +
ggtitle("Point Chart")+
geom_point(aes(size = 1.0), col = "green")+
geom_vline(xintercept = 2011)
|
Output:
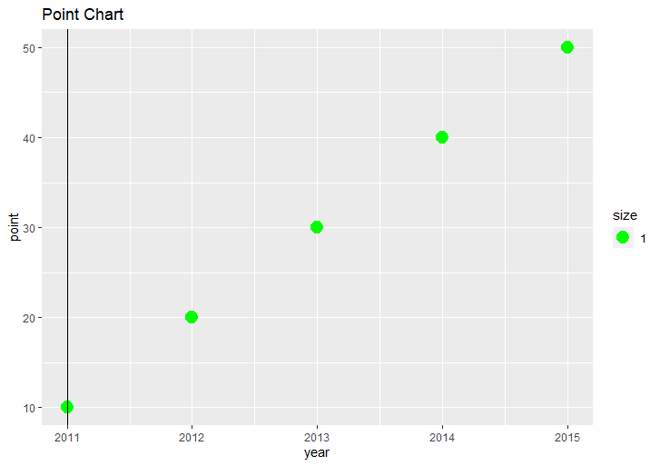
Scatter plot with vertical line at X=2011
Adding Horizontal Line To R Plot using geom_hline()
And for adding Horizontal lines to the R plot, we will use geom_hline() function:
Syntax: geom_hline(yintercept)
Parameter: here yintercept is used control the y position of line.
Return: Horizontal line on R plot.
Example: To add the horizontal line on the plot, we simply add geom_hline() function to ggplot2() function and pass the yintercept, which basically has a location on the Y axis, where we actually want to create a vertical line. Here we set 20 to the xintercept.
R
library(ggplot2)
data <- data.frame(year = c(2011, 2012, 2013, 2014, 2015),
point = c(10, 20, 30, 40, 50))
ggplot(data, aes(year, point)) +
ggtitle("Point Chart")+
geom_point(aes(size = 1.0), col = "green")+
geom_hline(yintercept = 20)
|
Output:
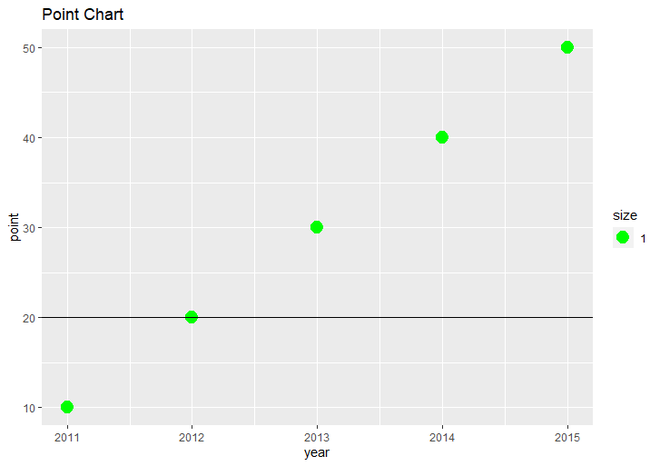
Scatter plot with Horizontal line at Y=20
Adding both vertical and horizontal lines to R plot
To add both lines, we add both geom_vline() and geom_hline() function to ggplot() function and set the values of xintercept and yintercept.
Example: Here we will draw the vertical line at X=2012 and the vertical line at Y=20.
R
library(ggplot2)
data <- data.frame(year = c(2011, 2012, 2013, 2014, 2015),
point = c(10, 20, 30, 40, 50))
ggplot(data, aes(year, point)) +
ggtitle("Point Chart")+
geom_point(aes(size = 1.0), col = "green")+
geom_vline(xintercept = 2012)+
geom_hline(yintercept = 20)
|
Output:
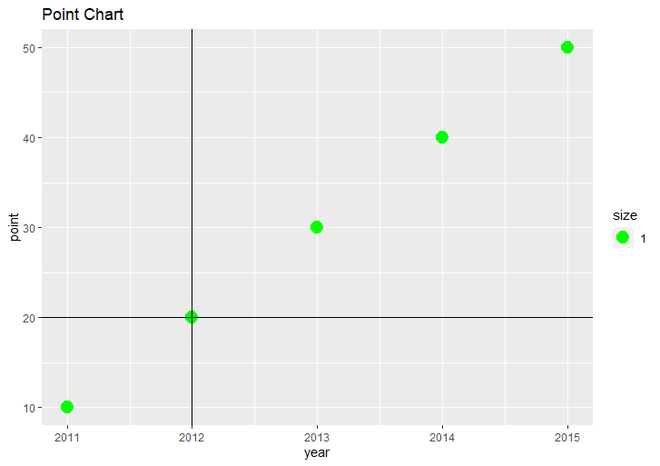
Scatter plot with both lines at X=2012 and Y=20
Adding multiple vertical and horizontal lines to R plot using seq() function
We will use seq() function to represent the xintercept and yintercept and all other settings will remain the same as example 3.
Syntax: seq(from, to, by)
Parameters:
- from : it is used to represent starting length.
- to: it is used to represent ending length.
- by: it represents increment of the system.
Return: well-formed sequence.
Example: Here we’re drawing vertical lines from 2011 to 2015 with a difference of 0.5 and horizontal lines from 10 to 50 with a difference of 5.
R
library(ggplot2)
data <- data.frame(year = c(2011, 2012, 2013, 2014, 2015),
point = c(10, 20, 30, 40, 50))
ggplot(data, aes(year, point)) +
ggtitle("Point Chart")+
geom_point(aes(size = 1.0), col = "green")+
geom_vline(xintercept = seq(from=2011, to=2015, by = 0.5))+
geom_hline(yintercept = seq(from=10, to=50, by = 5))
|
Output:
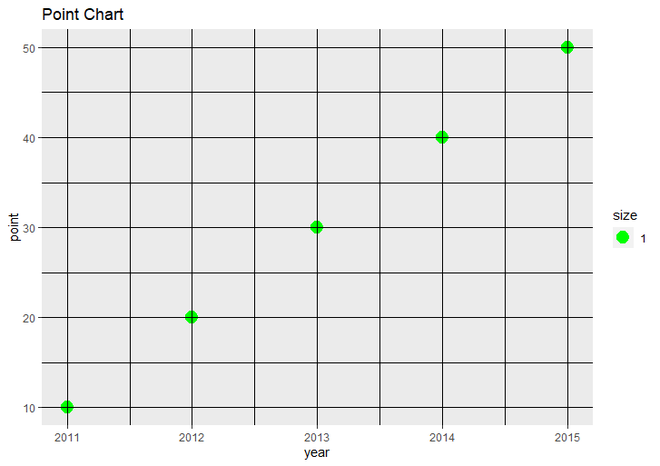
Scatter plot with multiple vertical and horizontal lines
Share your thoughts in the comments
Please Login to comment...