Set lines to different transparency using ggplot2 in R
Last Updated :
18 Jul, 2021
In this article, we will be discussing how can transparency of lines be made different for a line plot using GGPLOT2 in R programming language.
First, let’s plot a line graph, so that the difference is apparent.
R
library("ggplot2")
function1<- function(x){x**2}
function2<-function(x){x**3}
function3<-function(x){x/2}
function4<-function(x){2*(x**3)+(x**2)-(x/2)}
df=data.frame(x = -2:2,
values = c(function1(-2:2),
function2(-2:2),
function3(-2:2),
function4(-2:2)),
fun = rep(c("function1","function2",
"function3","function4"))
)
ggplot(df,aes(x,values,col=fun))+geom_line(size=3)
|
Output:
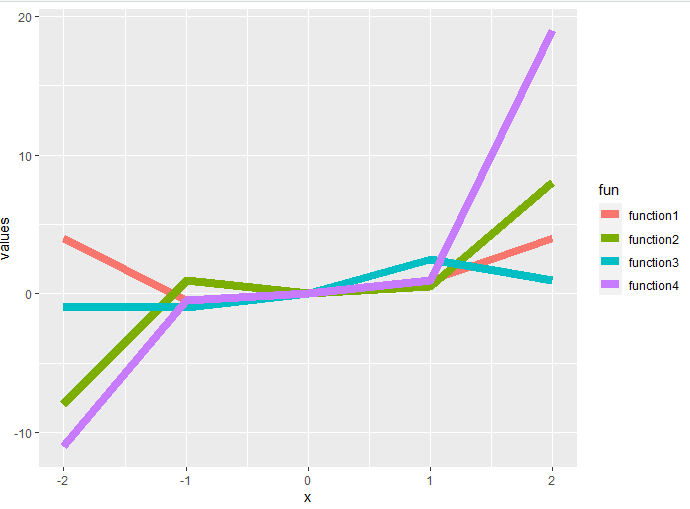
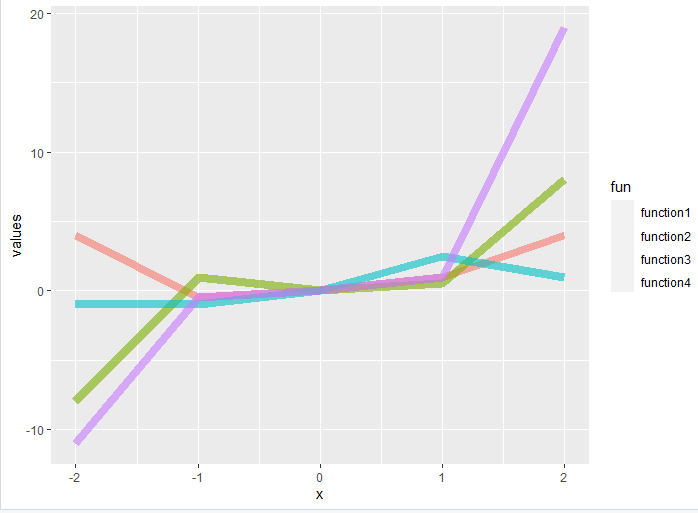
Same transparency for all lines
Let us first change the transparency of all the lines to the same value, for this alpha parameter is used. The maximum value it takes is 1, which makes it a solid line. To make it translucent, provide value(s) smaller than 1.
R
library("ggplot2")
function1<- function(x){x**2}
function2<-function(x){x**3}
function3<-function(x){x/2}
function4<-function(x){2*(x**3)+(x**2)-(x/2)}
df=data.frame(x=-2:2,
values=c(function1(-2:2),
function2(-2:2),
function3(-2:2),
function4(-2:2)),
fun=rep(c("function1","function2",
"function3","function4"))
)
ggplot(df,aes(x,values,col=fun))+geom_line(size=3, alpha=0.6)
|
Output:
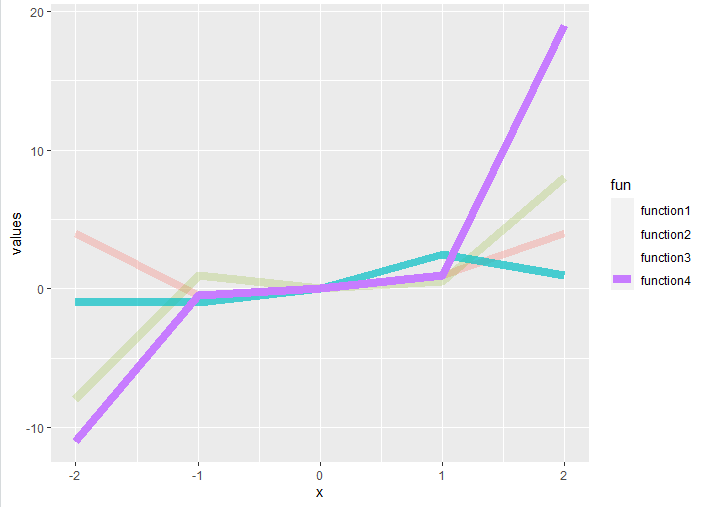
Define transparency manually
To change the transparency to some other value for each line, pass the value to differentiate transparency by the attribute of the dataset and then pass the vector with values for each transparency level to the scale_alpha_manual() function.
scale_alpha_manual() sets the values for alpha manually.
Syntax: scale_alpha_manual(values)
Code:
R
library("ggplot2")
function1<- function(x){x**2}
function2<-function(x){x**3}
function3<-function(x){x/2}
function4<-function(x){2*(x**3)+(x**2)-(x/2)}
df=data.frame(x=-2:2,
values=c(function1(-2:2),
function2(-2:2),
function3(-2:2),
function4(-2:2)),
fun=rep(c("function1","function2",
"function3","function4"))
)
ggplot(df,aes(x,values,col=fun))+geom_line(size=3, aes(alpha=fun))+
scale_alpha_manual(values=c(0.3,0.2,0.7,1))
|
Output:
Like Article
Suggest improvement
Share your thoughts in the comments
Please Login to comment...