How to display image using Plotly?
Last Updated :
01 Oct, 2020
A Plotly is a Python library that is used to design graphs, especially interactive graphs. It can plot various graphs and charts like histogram, barplot, boxplot, spreadplot, and many more. It is mainly used in data analysis as well as financial analysis. plotly is an interactive visualization library.
Displaying Image
The Imshow method is the fastest method to show the 2d data. This method is used to generate an image from the numerical data. The numerical data can be in the form of NumPy array.
Syntax: imshow(labels={}, x=None, y=None, color_continuous_scale=None, color_continuous_midpoint=None, range_color=None,width=None, height=None)
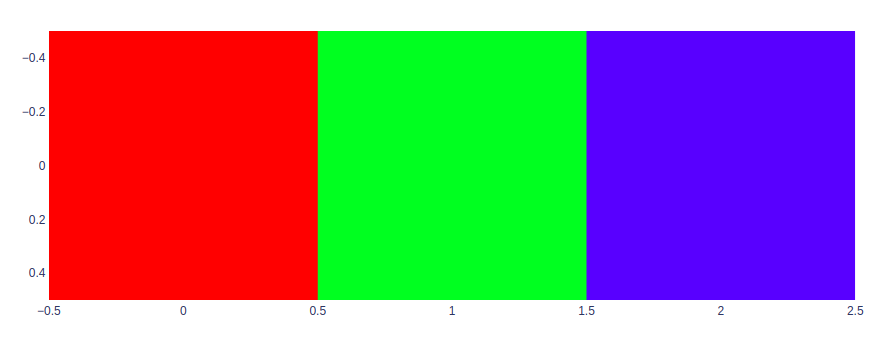
Displaying RBG data as image
This function can also show RGB data as an image. The data is provided in the format of NumPy array.
Example:
Python3
import plotly.express as px
import numpy as np
img_rgb = np.array([[[255, 0, 0], [0, 255, 0], [0, 0, 255]],
], dtype=np.uint8)
fig = px.imshow(img_rgb)
fig.show()
|
Output:
Displaying image from image files
A third-party library can be used like PIL, scikit-image, or OpenCV to read the image as an array.
Example:
Image used:

Python3
import plotly.express as px
import cv2
img = cv2.imread('GFG.png')
fig = px.imshow(img)
fig.show()
|
Output:

Share your thoughts in the comments
Please Login to comment...