Polar Charts using Plotly in Python
Last Updated :
29 Feb, 2024
A Plotly is a Python library that is used to design graphs, especially interactive graphs. It can plot various graphs and charts like histogram, barplot, boxplot, spreadplot, and many more. It is mainly used in data analysis as well as financial analysis. plotly is an interactive visualization library.
Polar Charts in Plotly
These charts use a polar coordinate system, where its x-axis looks like a circle with the origin point as a center and each point is determined by distance from a fixed point and angle from a fixed direction. Polar charts are also known as radar charts, web charts, spider charts, and star charts, and many others. The radial and angular coordinates names are given as r and theta arguments.
Syntax: plotly.graph_objects.Scatterpolar(arg=None, cliponaxis=None,dr=None, dtheta=None, line=None, marker=None,r=None, theta=None)
Parameters:
arg: dict of properties compatible with this constructor or an instance of plotly.graph_objects.Scatterpolar
r: Sets the radial coordinates
theta: Sets the radial coordinates
line: plotly.graph_objects.scatterpolar.Line instance or dict with compatible properties
marker: plotly.graph_objects.scatterpolar.Marker instance or dict with compatible properties
Example:
Python3
import plotly.graph_objects as go
fig = go.Figure(data=go.Scatterpolar(
r=[1, 2, 3, 4, 5, 6, 7, 8, 9],
theta=[69, 141, 213, 285, 357,
429, 501, 573, 645],
mode='markers',
))
fig.show()
|
Output:

Polar Bar Chart
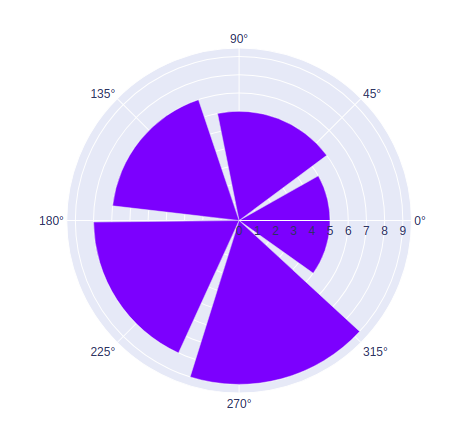
In plotly, a polar bar chart can be created by using go.Barpolar() method of graph_object class. A polar bar chart is a chart that displays the data in the categorical form and the x-axis is in the circle and the origin is in the center.
Example:
Python3
import plotly.graph_objects as go
fig = go.Figure(data=go.Barpolar(
r=[1, 2, 3, 4, 5, 6, 7, 8, 9],
theta=[69, 141, 213, 285, 357,
429, 501, 573, 645],
))
fig.show()
|
Output:
Line Polar Chart
In plotly, line polar charts can be made by using go.Scatterpolar() method of graph_object class. A line polar chart is a chart that displays data in series where the x-axis is in the circle and the origin is in the center.
Example:
Python3
import plotly.graph_objects as go
fig = go.Figure(data=go.Scatterpolar(
r=[1, 2, 3, 4, 5, 6, 7, 8, 9],
theta=[69, 141, 213, 285, 357,
429, 501, 573, 645],
mode='lines',
))
fig.show()
|
Output:

Share your thoughts in the comments
Please Login to comment...