How to change the legend shape using ggplot2 in R?
Last Updated :
30 May, 2021
In this article, we will discuss how to change only legend shape using ggplot2 in R programming language. Here ScatterPlot is used the same can be applied to any other plot.
Syntax : sample(x, size, replace = TRUE)
Parameters :
- x : either a vector of one or more values from which we want to choose the values or a positive integer. here we use column of Usernames as a first parameter (x).
- size : represents the length i.e number of values to choose from x.
- replace = TRUE : To assure that no value chosen twice i.e choose all different values from x.
Return : returns sample data as per arguments.
Let us first create a regular plot first so that difference is apparent.
Example:
R
library("ggplot2")
data<-data.frame(x = rnorm(20),
y = rnorm(20),
Users = sample(c("User 1", "User 2",
"User 3", "User 4",
"User 5"),
20, replace=TRUE))
ggplot(data,aes(x, y, color = Users))+
geom_point(size = 10)
|
Output:
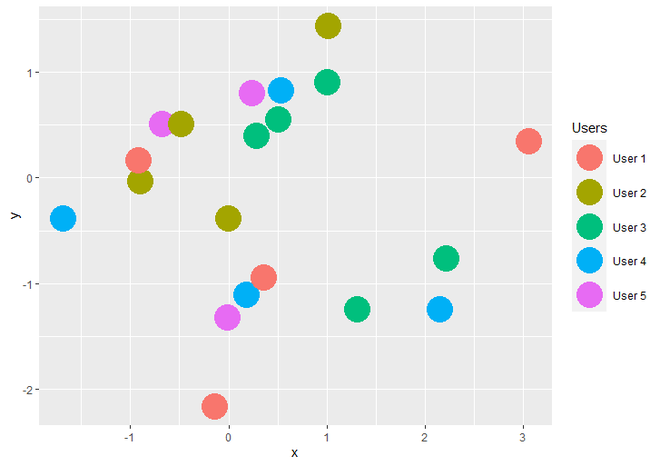
ScatterPlot with Legend using ggplot2
Now if we want to change only Legend shape then we have to add guides() and guide_legend() functions to the geom_point() function. Inside guides() function, we take parameter named ‘color’ because we use color parameter for legend in ggplot() function. ‘color’ has call to guide_legend() guide function as value. Inside guide_legend() function, we take an argument called override.aes, which has the list of aesthetic parameters of legend as a value.
Syntax : guides(…)
Parameter :
- … : either a string or call to a guide function. here we call guide_legend() guide function.
Return : each scale can be set scale-by-scale
Syntax : guide_legend(override.aes = list() )
Parameter :
- override.aes : List of aesthetic parameters of Legend. here we want to change only the shape of the legend key, So we assign ‘shape’ parameter to list. it can have some other parameters as per user’s requirement like color, size, etc as well.
Return : Legend Guides for various scales
Here for a set value for the shape parameter. Given below are the values to choose from:
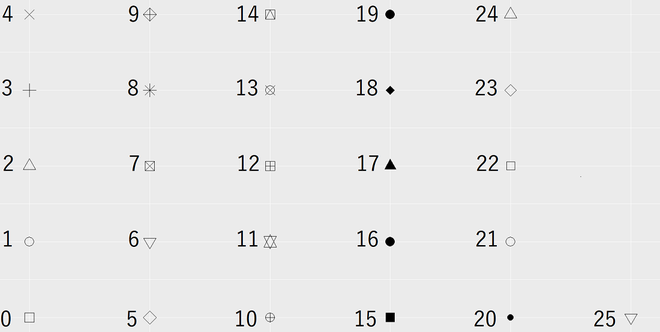
Shapes of Points of Legend with Range
Example:
R
library("ggplot2")
data<-data.frame(x = rnorm(20),
y = rnorm(20),
Users = sample(c("User 1", "User 2", "User 3",
"User 4", "User 5"),
20, replace=TRUE))
ggplot(data,aes(x, y, color = Users))+
geom_point(size = 10)+
guides(color = guide_legend(
override.aes=list(shape = 18)))
|
Output:
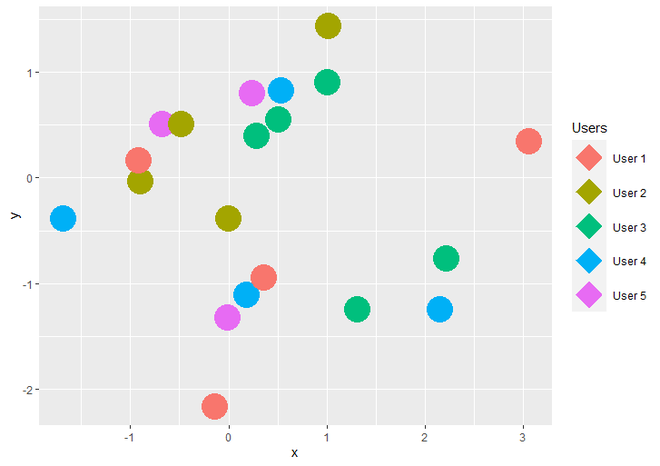
ScatterPlot with changed shape of Legend
Share your thoughts in the comments
Please Login to comment...