How To Fold Legend into Two Rows in ggplot2 in R
Last Updated :
04 Nov, 2022
In this article, we are going to see how to draw a ggplot2 legend with two Rows in R Programming Language.
If we want to draw ggplot2 Legend with two rows, we have to add guides and guide_legend functions to the theme() function. Inside guides() function, we take parameter named color, which has call to guide_legend() guide function as value.
Inside the guide_legend() function, we take an argument called nrow, which has the desired number of rows of legend as value.
Syntax : guide_legend(nrow)
Parameter :
nrow : The Desired Number of rows of legend.
Return : Legend Guides for various scales
Dataframe in use:
  Batch Students                        Class
1  2017     2300                DSA Essential
2  2018     1200                 Placement100
3  2019     3500                  C++: Expert
4  2020     1400     Web Development Bootcamp
5  2021      120 Android Development Bootcamp
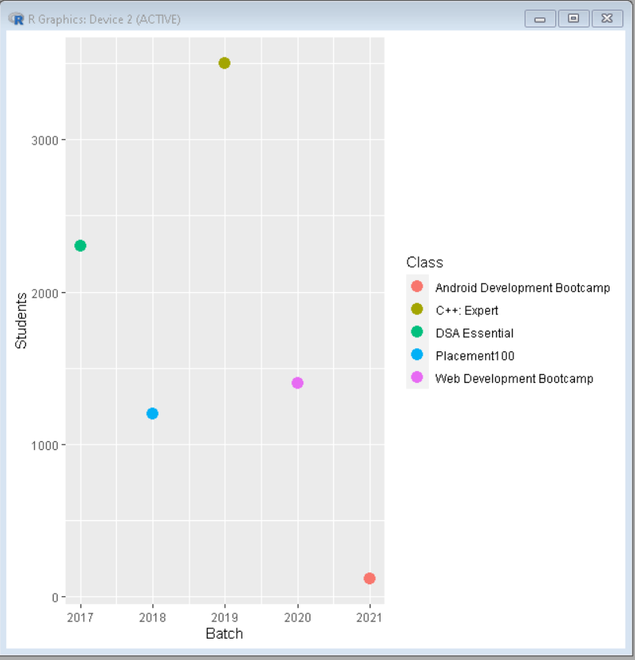
To Create an R plot, we use ggplot() function, and to make it a scatter plot we add geom_point() function, assign this whole plot to ggplot data object. Let us first create a regular plot so that the difference is apparent.
Example: Default legend
R
library("ggplot2")
data <- data.frame(Batch = c(2017, 2018, 2019, 2020, 2021),
Students = c(2300, 1200, 3500, 1400, 120),
Class = c("DSA Essential", "Placement100",
"C++: Expert", "Web Development Bootcamp",
"Android DevelopmentBootcamp"))
ggplot(data, aes(Batch, Students, color = Class)) +
geom_point(size = 4)
|
Output:
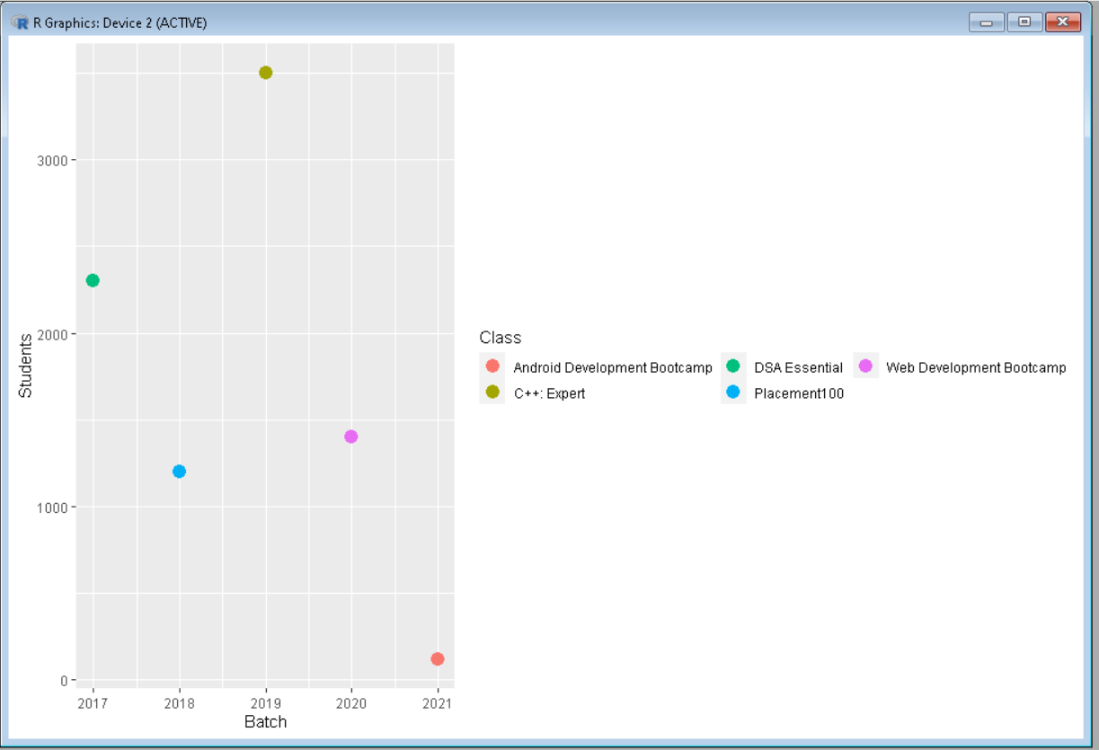
Now to fold the legend, add guides() function with color as guide_legend() together with parameter nrow=2, which folds legend into two-row.
Example: Legend folded into 2 rows
R
library("ggplot2")
data <- data.frame(Batch = c(2017, 2018, 2019, 2020, 2021),
Students = c(2300, 1200, 3500, 1400, 120),
Class = c("DSA Essential", "Placement100",
"C++: Expert", "Web Development Bootcamp",
"Android Development Bootcamp"))
ggplot(data, aes(Batch, Students, color = Class)) +
geom_point(size = 4) +
guides(color = guide_legend(nrow = 2))
|
Output:
Like Article
Suggest improvement
Share your thoughts in the comments
Please Login to comment...