Control Line Color and Type in ggplot2 Plot Legend in R
Last Updated :
21 Jul, 2021
In this article, we will see how to control line color and type in ggplot2 plot legend in the R programming language.
Using Default Parameters
In this method, inbuilt attributes are passed to the function with appropriate values to generate the requirement. Thus, in order to change the color, col or color attribute has to be passed with the column name from the dataframe on the basis of which distinction has to be made.
Syntax: aes(col= column_name)
Similarly, to control line type, linetype attribute needs to be passed with the column name of the dataframe.
Syntax: aes(linetype= column_name )
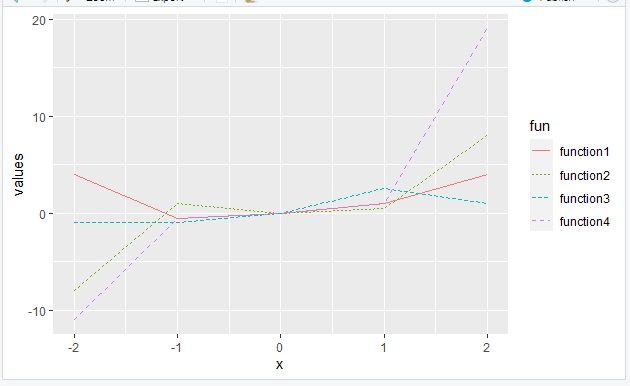
Example: Controlling line color and type using default parameters
R
library("ggplot2")
function1 <- function(x){x**2}
function2 <- function(x){x**3}
function3 <- function(x){x/2}
function4 <- function(x){2*(x**3)+(x**2)-(x/2)}
df = data.frame(x = -2:2,
values = c(function1(-2:2),
function2(-2:2),
function3(-2:2),
function4(-2:2)),
fun = rep(c("function1","function2",
"function3","function4"))
)
ggplot(df, aes(x, values, color = fun,
linetype = fun)) + geom_line()
|
Output:
Changing manually
Under this method, the color of the line plot is controlled using the scale_color_manual() function, which is passed with a vector of colors for each line.
Syntax: scale_color_manual(vector)
Similarly, linetype can be controlled using scale_linetype_manual() function, this also takes a vector as an input but the values passed are different linetypes for each line.
Syntax: scale_linetype_manual(vector)
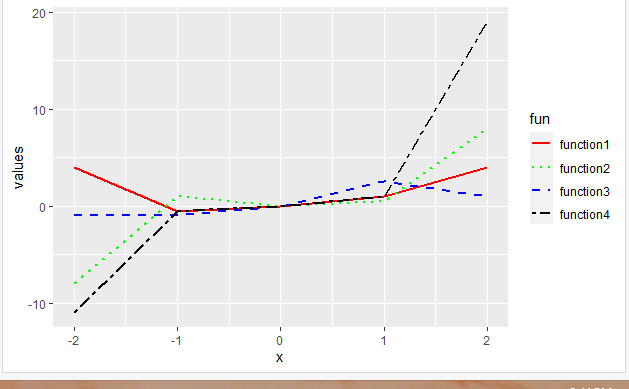
Example: Controlling line color and type manually
R
library("ggplot2")
function1<- function(x){x**2}
function2<-function(x){x**3}
function3<-function(x){x/2}
function4<-function(x){2*(x**3)+(x**2)-(x/2)}
df=data.frame(x=-2:2,
values=c(function1(-2:2),
function2(-2:2),
function3(-2:2),
function4(-2:2)),
fun=rep(c("function1","function2","function3","function4"))
)
ggplot(df,aes(x,values, group=fun, color=fun, linetype=fun))+geom_line(size=1)+
scale_linetype_manual(values = c("solid","dotted","dashed","twodash"))+
scale_color_manual(values=c("red","green","blue","black"))
|
Output:
Share your thoughts in the comments
Please Login to comment...