Change Spacing Between Horizontal Legend Items of ggplot2 Plot in R
Last Updated :
17 Jun, 2021
In this article, we are going to see how to change the space between horizontal legend items using the ggplot2 bar plot in R programming language.
Here we are using a bar graph the same can be done to any other plot. For creating a simple bar plot we will use the function geom_bar( ).
Syntax:
geom_bar(stat, fill, color, width)
Parameters :
- stat : Set the stat parameter to identify the mode.
- fill : Represents color inside the bars.
- color : Represents color of outlines of the bars.
- width : Represents width of the bars.
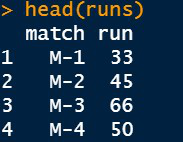
Data in use:
Let us first create a regular plot so that the difference is apparent.
Example:
R
library(ggplot2)
runs <- data.frame(match=c("M-1","M-2","M-3","M-4"),
run=c(33, 45, 66, 50))
IPL <-ggplot(data=runs, aes(x=match, y=run,fill=match)) +
coord_flip()+
geom_bar(stat="identity")+
theme_classic()+
theme(legend.position = 'bottom')
IPL
|
Output:

legend with default spacing
To change the space between the horizontal legends we have to use the command below:
legend.x = unit( unit_value, ‘cm’)
The command has to be written inside the theme( ) function where we have already assigned the position of the legend before.
Example:
R
library(ggplot2)
runs <- data.frame(match=c("M-1","M-2","M-3","M-4"),
run=c(33, 45, 66, 50))
IPL+theme(legend.spacing.x = unit(0.5,'cm'))
IPL+theme(legend.spacing.x = unit(1,'cm'))
|
Output:

Legend with space of 0.5 cm

Legend with space of 1 cm
Like Article
Suggest improvement
Share your thoughts in the comments
Please Login to comment...