Change Display Order of ggplot2 Plot Legend in R
Last Updated :
23 Jan, 2023
In this article, we will see how to change display order of ggplot2 legend in R Programming Language.
For that, first we should load ggplot2 package using library() function. Syntax for loading or installing ggplot2 package is given below. to install ggplot2 package, write following command to R Console.
install.packages("ggplot2")
library("ggplot2")
To Create a plot, we use ggplot() function and for make it scatter plot we add geom_point() function to ggplot() function.
R
library("ggplot2")
DF <- data.frame(Year = c(2011, 2012, 2013, 2014, 2015),
Points = c(30, 20, 15, 35, 50),
Users = c("User1", "User2", "User3", "User4", "User5"))
ggplot(DF,aes(Year, Points, color = Users))+
geom_point(size = 10)
|
Output:
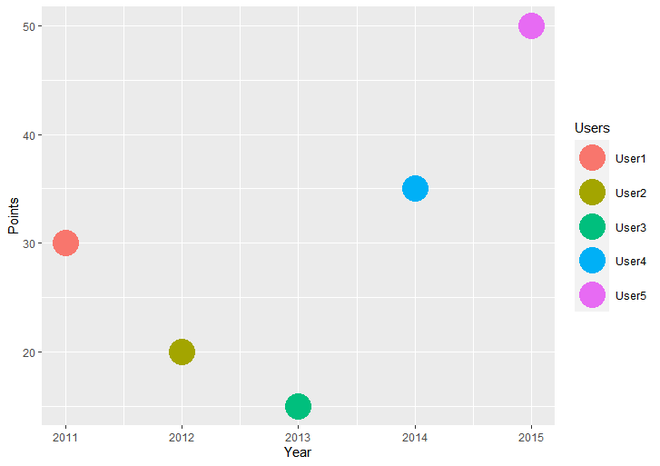
Simple Scatter Plot with Legend
Changing the order of Legend to Desired Order :
Now for Changing the order of Legend, we have to create new dataframe, let us say newDF. Here we will copy old DataFrame (DF) to new dataframe (newDF) because we only want to change the order of legend. To copy DF to newDF, we simply assign DF to newDF.
newDF <- DF
For changing the order of wsers, we will use factor() function and inside factor we will use levels parameter to assign the new order of Legend.
Syntax : factor(x, levels)
Parameter :
- x : A Data Object, which takes distinct values. here we want to change only Users column of dataframe. for that we will use newDF$Users as a first parameter (i.e. inplace of x)of factor
- levels : A Character string or column that determines the new order of x vector
Return : Encode a vector as a Factor.
newDF$Users <- factor(newDF$Users, levels = c(“User4”, “User1”, “User5”, “User2”, “User3”))
Now, we will simply create a ScatterPlot with this New DataFrame using as always ggplot() and geom_point() function.
R
library("ggplot2")
DF <- data.frame(Year = c(2011, 2012, 2013, 2014, 2015),
Points = c(30, 20, 15, 35, 50),
Users = c("User1", "User2", "User3",
"User4", "User5"))
newDF <- DF
newDF$Users <- factor(newDF$Users,
levels = c("User4", "User1", "User5",
"User2", "User3"))
ggplot(newDF,aes(Year, Points, color = Users))+
geom_point(size = 10)
|
Output:
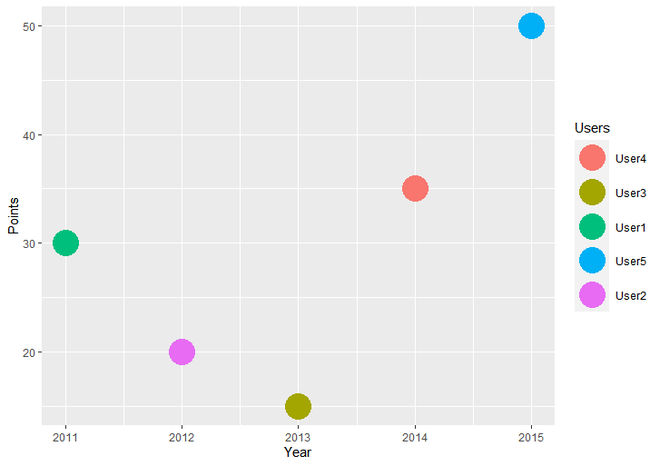
Scatter Plot with Modified Order of ggplot2 Legend
Reversing the Order of Legend
For Reversing the order of legend, we simply use rev() function as a value of levels parameter of factor function and inside rev() function, we assign the order of values that we want to reverse.
Syntax : rev(x)
Parameter :
- x : rev function has only one parameter, which represents the vector or other Data Object that we want to reverse its order, DF$Users in our example.
Return : Reversed order of its argument.
newDF$Users <- factor(newDF$Users, levels = rev(DF$Users))
R
library("ggplot2")
DF <- data.frame(Year = c(2011, 2012, 2013, 2014, 2015),
Points = c(30, 20, 15, 35, 50),
Users = c("User1", "User2", "User3", "User4", "User5"))
newDF <- DF
newDF$Users <- factor(newDF$Users,
levels = rev(DF$Users))
ggplot(newDF,aes(Year, Points, color = Users))+
geom_point(size = 10)
|
Output:
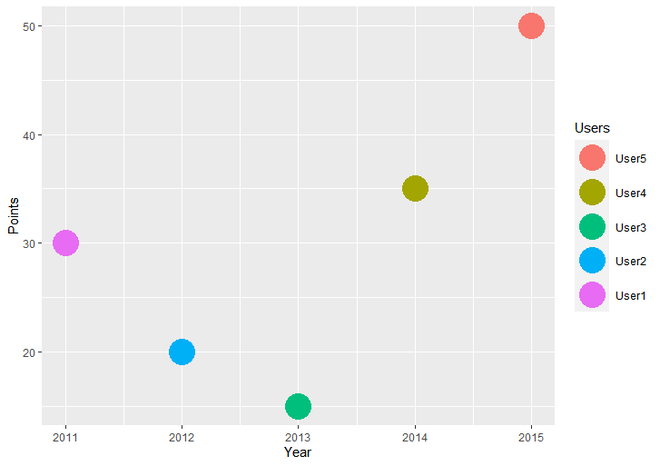
Scatter Plot with Reversed Order of ggplot2 Legend
Like Article
Suggest improvement
Share your thoughts in the comments
Please Login to comment...