Console Tool in Microsoft Edge Browser
Last Updated :
11 Oct, 2023
The Console tool is used to check JS errors and warnings but it can also be used to manipulate the JS of the webpage. The tool can also be used alongside with other DevTools as by default it is present in the drawer of the DevTools.
Overview of Console Tool
The console tools is present in the DevTools of Edge and basically used to view logs produced by the JS of the web page. This logs can be errors, warnings, users messages etc. The tool also provides JS support which you can use to monitor or manipulate the site or you can just run any JS code which may not be related to the JS. Every console.log() used by the Developers is displayed in the console and this can be used by the developers to debug the site by checking various values related to the site.
Features of Console Tool
The various features of the Console Tool are:
- Color coded logs: The errors are displayed in red and all other logs are displayed in yellow except the user messages. User messages are console logs present in the JS code of the webpage that may be intentionally used to convey a message or print values during development.
- Built-in JS support: You can type JS code which may or may not be used to manipulate the webpage. You can simple use the console to run JS code which may not be related to the webpage at all.
- Multi toolbar support: You can use console tool in the the main toolbar or use it in the drawer toolbar. If you want to work of any of the DevTools but don’t want to switch between that tool and the Console Tool then you can just use the drawer of the DevTools which have the console tab by default, it increases the productivity of the developers.
- Multiple ways to filter: You can filter the logs base of there type such as errors, warnings, user messages etc. You can also use the sidebar if you find filter to be cumbersome.
Benefits of Console Tool
The tool allows you to check for various logs of the webpage and also allows you to manipulate the webpage. Some of the benefits of the tool are:
- Easy distinction: With the color coded logs the and the sidebar providing categories its very easy to differential the various logs and focus only the type you want to work on. If you want to work on error logs just filter the error logs or use the sidebar and select the errors category.
- Finding problems: The tool helps us to view the different warnings and errors in the webpage. This helps during development as it clearly explain the problems and provide links to open files in sources tab.
- DOM manipulation and inspection: You can manipulate the DOM of the web page or preview various DOM elements and there values. The tool come with JS support so plain JS methods and properties can be used for DOM manipulation.
When to use Console Tool?
The console tool is basically used to view the different logs of the website JS. The various reasons for using the Console Tool are:
- Debugging the web page: You can use console.log in JS to check for various information and log some information which can be helpful during development phase. Developers use console.log in JS during developing the browser and when its being runned of the website the logs are displayed in the console tool.
- Viewing Logs of the web page: The console also displays error and warnings messages which can be referred during development to improve of fix the web page. Errors and warnings are colored coded to separate it from the user or developer generated logs.
- Getting the DOM information of the web page: You can type plain JS in the console to get certain information of the webpage which can be related to the DOM. You can also use live expression options to pinned out some DOM elements with frequent updation so that you don’t have to type the JS code again and again.
- Modifying the DOM of the web page: You can also type JS to modify the DOM elements and getting the modification preview live in the web page. You can do various kind of DOM manipulation such as deleting elements, adding child elements etc.
Locating the Console Tool in Edge
The Console Tool in by default present in the Developers tools and you can use the tool in main toolbar or you can also use the tool in the drawer toolbar in DevTools.
- Opening in main toolbar: You can directly open DevTools with the console tab by using the shortcut key “Ctrl+Shift+J”.
- Opening in drawer toolbar: You can press Esc key in your keyboard while in DevTools to open the drawer pane. By default the drawer toolbar will have the console tab.

Opening Console tab in both main toolbar and drawer toolbar using shortcut keys
UI of the Console Tool
The tool provides various option related to the logs that are being displayed, lets move left to right and understand these options.

Various options in the Console tab
Console sidebar
You can view the logs as categories of there types using the console sidebar which can be shown or be hidden using the sidebar button. This sidebar helps to quickly look at only the specific types of logs such as errors or warnings. The categories can also be expanded to select the file and view only the logs of that file.

Enabling Sidebar
Clear console
You can clear the console completely using this option. This helps to clean console so that you may work on typing the JS code. You can also use the shortcut key “Ctrl+L” to clear the console.

Clearing the Console
JavaScript context
You are provide with a drop-down list of various frames used in the browser which when selected allows the JS code to work on that selected frame. This is done to because the JS code that you type in the console tab will work on only the selected frame.

Changing JS context
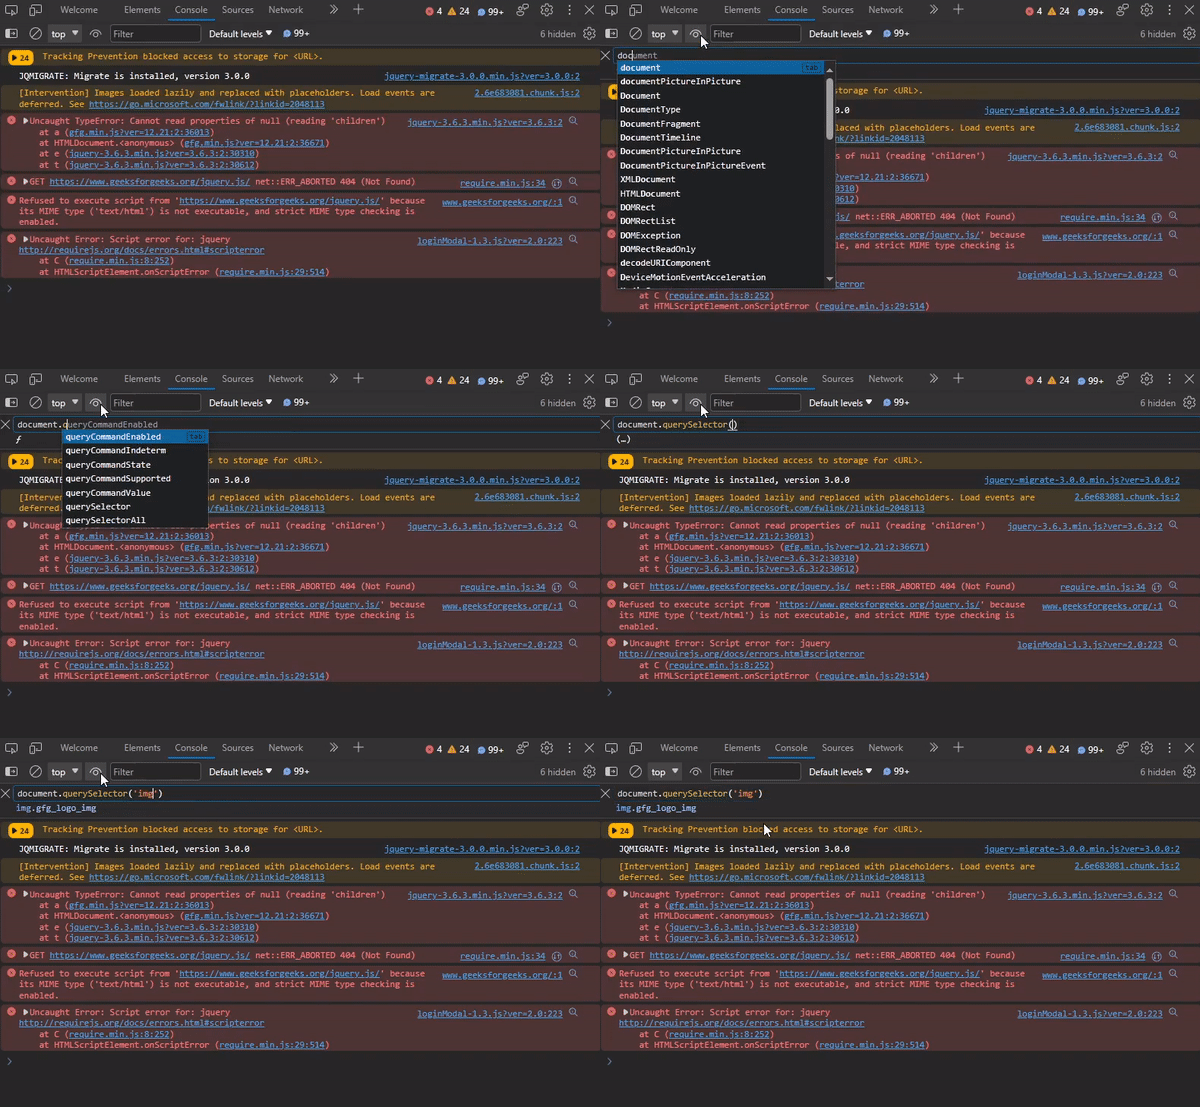
Create live expression
You may check a JS expression regularly and may have to type the expression whenever you want to check and also the console can get very untidy, to solve this problem you can add the expression as live expression. Live expression are pinned expression whose values regularly gets updated and you don’t have to type the expression multiple times. Select the eye option and type the expression in the text input that appears and then press enter to add the live expression.

Adding Live Expression
Filter
You can filter the logs by typing the characters or using regular expression. This helps you to search specific characters in the logs for quick and easy viewing. The regular expression must be between two slashes ( / ).

Searching in the logs
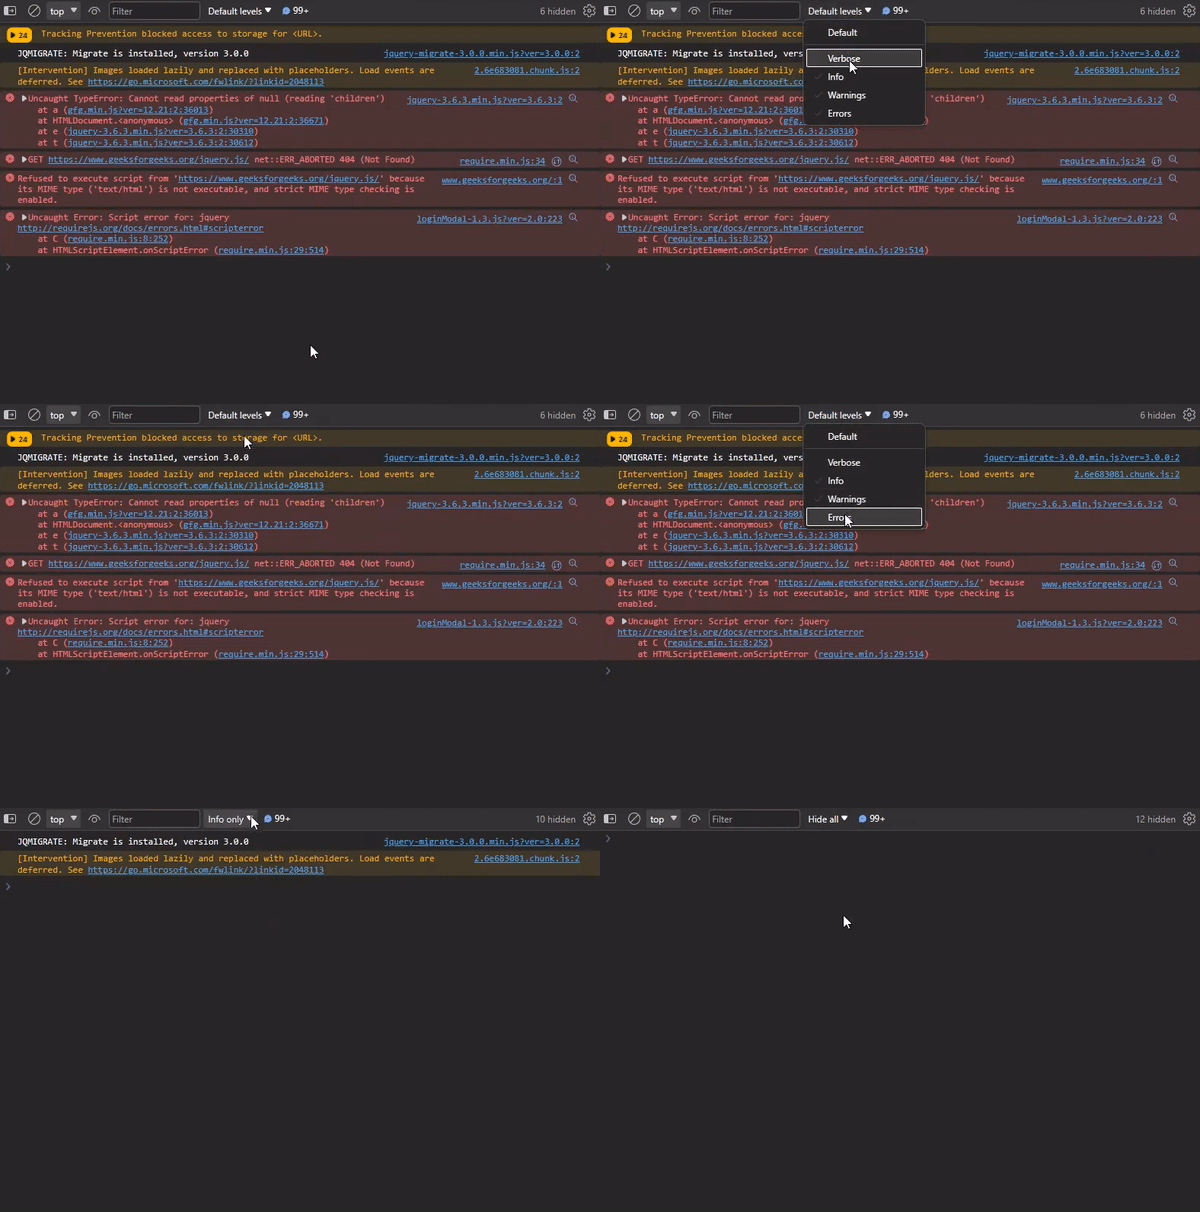
Log level
You can filter the logs using the drop-down list with respect to there types such as errors, warnings and info. If sidebar is displayed then this drop-down list is greyed out and can’t be used.

Filtering different log level
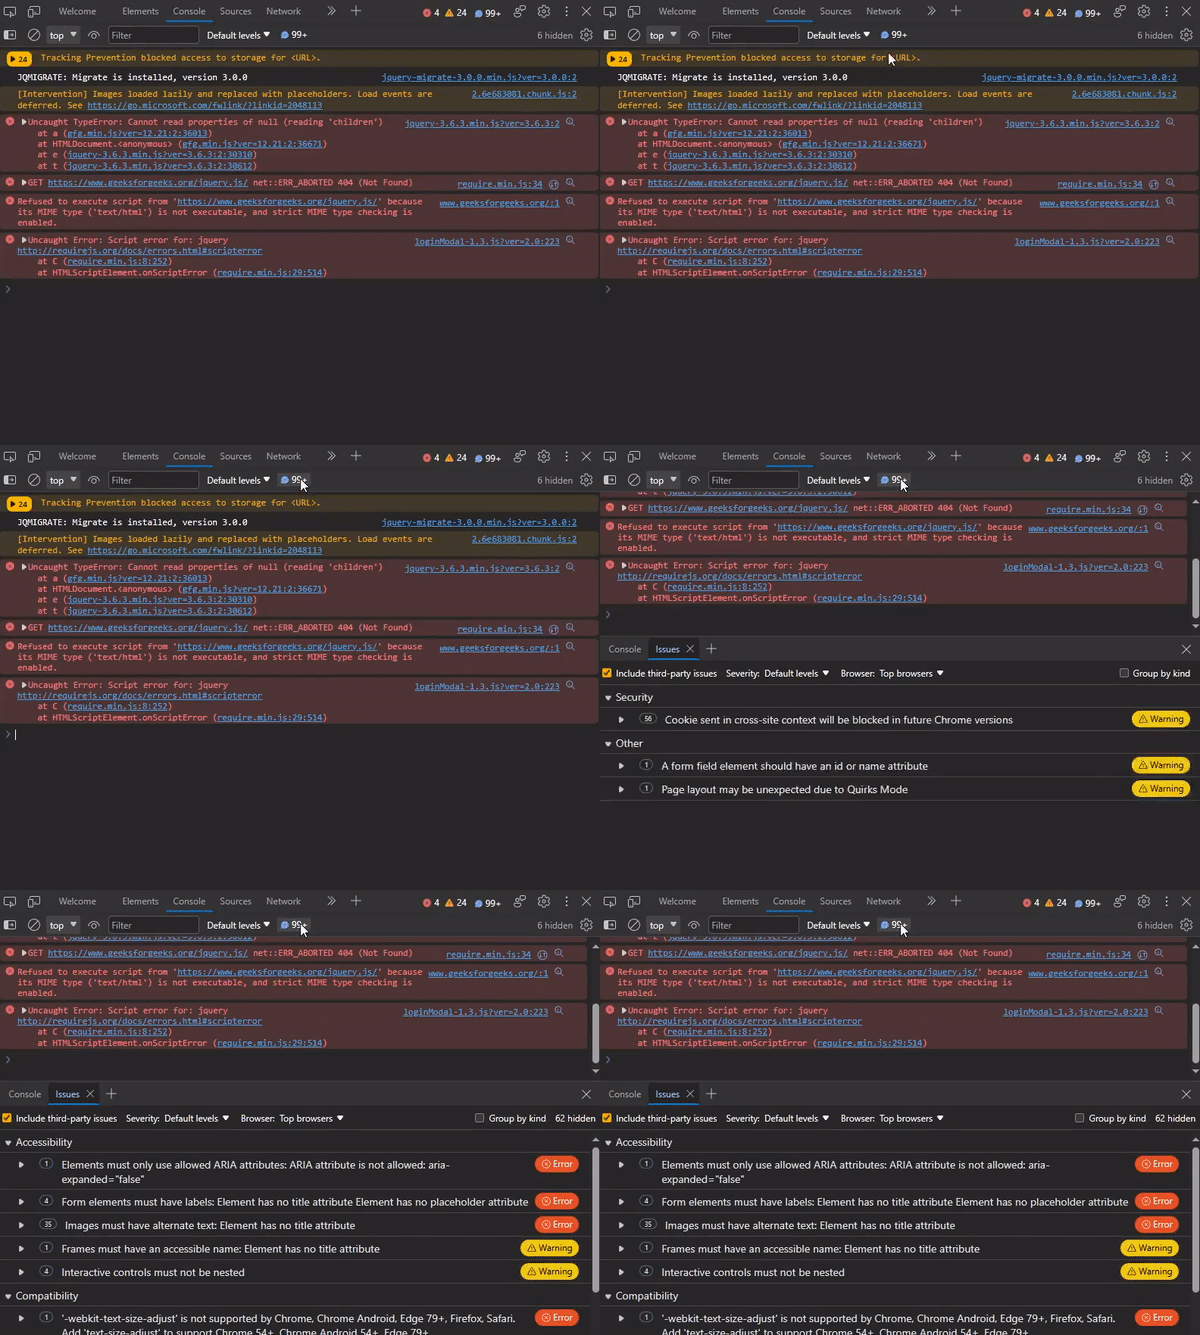
Displaying Number of Issues
The no. of issues in the site is displayed in the top of the console which indicates possible improvements that can be done to the webpage. On click it the issues tab gets opened in the drawer of the DevTools.

Opening Issues tab
Console Settings
The settings provide various options that can be enabled or disable in the console tool such as Group similar message, Autocomplete from history, hide network messages etc.

Changing Console Settings
Using the Console Tool
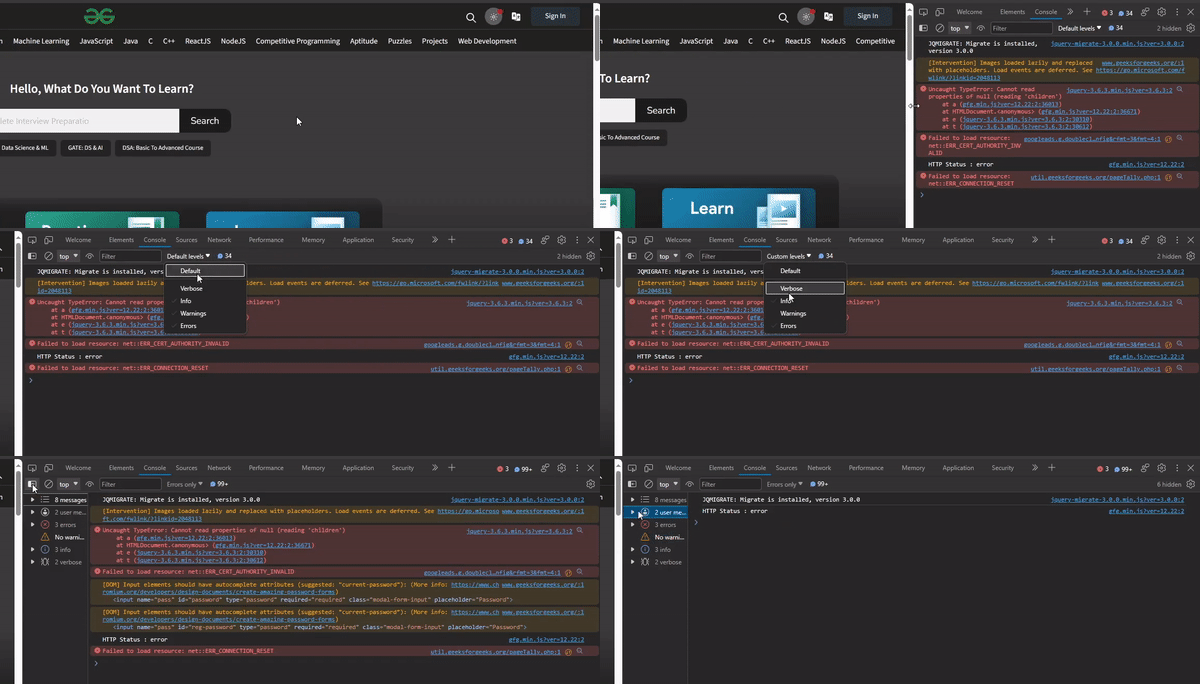
Follow the steps below to view various types of logs of the GFG website.
Step 1: Using Edge browser visit GFG web page and then press the shortcut key “Ctrl+Shift+J”.
Step 2: You will find that the DevTools get opened with the console tab. In the tab there are various logs type which are errors, warnings etc. You can filter the logs on the basis of the type that you want to work on.
Step 3: Use this information to debug the web page or use JS to check for various DOM elements of the web page.

Example of Console Tool
Conclusion
During development of the webpage you may get many errors, warnings or use console log for viewing or debugging purposes. All of this information and messages are displayed in the console tab. The tab comes with JS support that lets you type any JS code that can be used to manipulate the webpage. You can use this tab in the drawer while using other DevTools to save time.
Share your thoughts in the comments
Please Login to comment...